
September was the 7th month of the COVID crisis in the U.S. labor market, and the situation is dire. We added 661,000 jobs in Sept, but the labor market remains in crisis—we lost so many jobs in March and Apr that we are still 10.7 million jobs below where we were in Feb. 1/
And, nearly a quarter of a million jobs right now—247,000—are temporary jobs related to the decennial census that will disappear in the next few months. Not counting temporary census jobs, our jobs deficit is now 11.0 million jobs. 2/ census.gov/content/dam/Ce…
Further, in the year before the recession, we added 194,000 jobs per month on average, so from Feb-Sep, we should have added around 1.4 million jobs. That means the total gap in the labor market right now is on the order of 12.3 million jobs. 3/
And, the pace of job growth is slowing—we are adding fewer and fewer jobs each month. Slowing job growth is a disaster when you are 12.3 million jobs in the hole. This is not the V-shaped recovery that could get us out of this hole in a reasonable timeframe. 4/
Key policies for boosting the economy are fiscal aid to state and local governments and extending the unemployment insurance provisions of the CARES Act. These actions alone could create or save over 10 million jobs. 5/epi.org/blog/without-f… epi.org/blog/cutting-u…
Without these actions, the resulting drag on growth could lead to the U.S. reentering a recession. This really important post by @joshbivens_dc explains how. 6/ epi.org/blog/the-first…
The official unemployment rate was 7.9% in September. That is higher than the unemployment rate ever got in either the early 1990s or the early 2000s recessions. And, the unemployment rate is not counting all coronavirus-related job losses. 7/
In September, there were 12.6 million workers who were officially unemployed. But there were an additional 0.8 million workers who were temporarily unemployed but who were being misclassified as “employed not a work.” 8/
There were also 5.1 million workers who were out of work as a result of the virus but who were being counted as having dropped out of the labor force because they weren’t actively seeking work. 9/
And there are at least another 2.5 million who are unemployed but are not being counted as unemployed because CPS survey nonresponse is nonrandom, and nonresponders are more likely than the general population to be unemployed. 10/ econweb.ucsd.edu/~jhamilto/AH2.… rand.org/pubs/working_p…
That’s 21.0 million workers who were either officially unemployed or otherwise out of work as a result of the virus in September. If all these workers were taken into account, the unemployment rate would have been 12.5% in September. 11/
There are also 9.1 million workers who are employed but have seen a drop in hours and pay as a result of the virus. 12/ bls.gov/cps/covid19/co…
So altogether, 21.0 million workers are either officially unemployed or otherwise out of work because of the virus, and another 9.1 million are employed but have seen a drop in hours and pay, for a total of 30.1 million workers directly hurt by the COVID recession. 13/
That is nearly 18% of the workforce! And it doesn’t count those who lost a job or hours earlier in the pandemic but are back to work now. The cumulative count of those harmed would be much greater. 14/
The 30.1 million also ignores the fact that even workers who are employed and haven't had their hours cut are hurt by the recession. When job openings are scarce, workers’ leverage dissolves. Employers don’t have to pay well when they know workers don’t have outside options. 15/
How do the Sep jobs numbers square with Sep unemployment insurance (UI) claims? The UI data say that during the week ending Sep 12 (the reference week for the jobs data), there were 26.5 million workers claiming unemployment benefits in all programs. 16/ dol.gov/ui/data.pdf
That is higher that the 21.0 million workers who are either officially unemployed or otherwise out of work because of the virus (the 21.0 million is described above). What gives? 17/
For one, the 26.5 million is an overestimate the number of people claiming UI for a few reasons. This blog post has more on that. 18/ epi.org/blog/at-least-…
Also, some people with jobs who have reduced earnings are on “partial” UI. As described earlier in this thread, there are 9.1 million workers who are employed but have seen a drop in hours and pay due to COVID. That also explains some of the difference. 19/
Note, today's jobs data are yet another reminder that the $600 weekly UI payments were not hampering the labor market. In May/June/July, while the $600 was in place, 9.3 million people went back to work. After the $600 expired, job growth didn't accelerate, it slowed sharply. 20/
One thing that characterized the period of job growth of the last five months is that it has been deeply racially inequitable. 21/
Backing up: One surprising thing about the job loss of March and April is that it was fairly racially equitable—the black and white unemployment rates both rose by about 11 percentage points. But the period since then has been a totally different, and devastating, story. 22/
Since the peak, the white unemployment rate has come down more than 50% faster than the black unemployment rate. The white unemployment rate is now 7%, while the black unemployment rate is 12.1%. 23/
Our history and present of structural racism dramatically affect the labor market. B/c of things like occupational segregation, discrimination, & other disparities rooted in white supremacy, this crisis is hitting Black and Brown workers far harder than white workers. 24/
For more on the persistent Black-white unemployment gap and how it has played out in this crisis, this piece by @gbenga_ajilore is a must read. 25/ americanprogress.org/issues/economy…
Another deeply concerning thing in the numbers is that we are down 1.2 million state and local government jobs over the last 7 months—more than two-thirds of them (836,000) in education. This will only get worse if Senate Republicans keep blocking state and local govt aid. 26/
Also, the decline in unemployment in September came entirely from those who had been temporarily laid off. There was a surge of 351,00 workers who have been permanently laid off. This does not bode well AT ALL for the pace of the recovery. 27/
September was the seventh month of the COVID crisis, which means long-term unemployment (unemployment lasting more than six months) is beginning to spike. In Sept there was an increase of more than three-quarters of a million (781,000) long-term unemployed workers. 28/
The thing I'm the most worried about on this #jobsday? The dramatic slowdown in job growth. This is *really* not the shape of recovery we want to be seeing when there is a gap in the labor market of over 12 million jobs. 29/ 
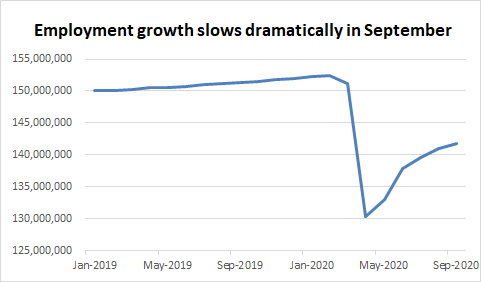
We have gained back only about half of the jobs we lost in March and April, and employment growth is *slowing.* This is a disaster for working families in this country. 30/
FOLKS. The decline in the unemployment rate in September was mostly for bad reasons—people dropping out of the labor force, not people getting jobs. (Jobs were definitely added, but the change driving the decline in the unemp rate was—by far—the drop in the labor force.) 31/
What’s not getting enough attention in the #jobsreport? THIS: We’re down 1.2 million state & local govt jobs over the last 7 months—most of them (836,000) in education. THIS IS A MINDBOGGLING UNFORCED ERROR. Congress can fix this immediately with aid to state & local governments.
A reminder that it is absolutely not true that "everyone" is working from home—only 22.7% of employed people report having teleworked or worked at home in the last month. That's less than one in four workers! bls.gov/cps/covid19/co…
• • •
Missing some Tweet in this thread? You can try to
force a refresh


