Weekly round up of useful / reliable English covid statistics:
1. Incidence
2. Care home outbreaks
3. Hospital & ICU admissions and deaths
4. Covid triage
5. Cases
6. Contact tracing
7. The Vallance-tracker
8. Mortality
9. Miscellaneous
#ahcveng
1. Incidence
2. Care home outbreaks
3. Hospital & ICU admissions and deaths
4. Covid triage
5. Cases
6. Contact tracing
7. The Vallance-tracker
8. Mortality
9. Miscellaneous
#ahcveng
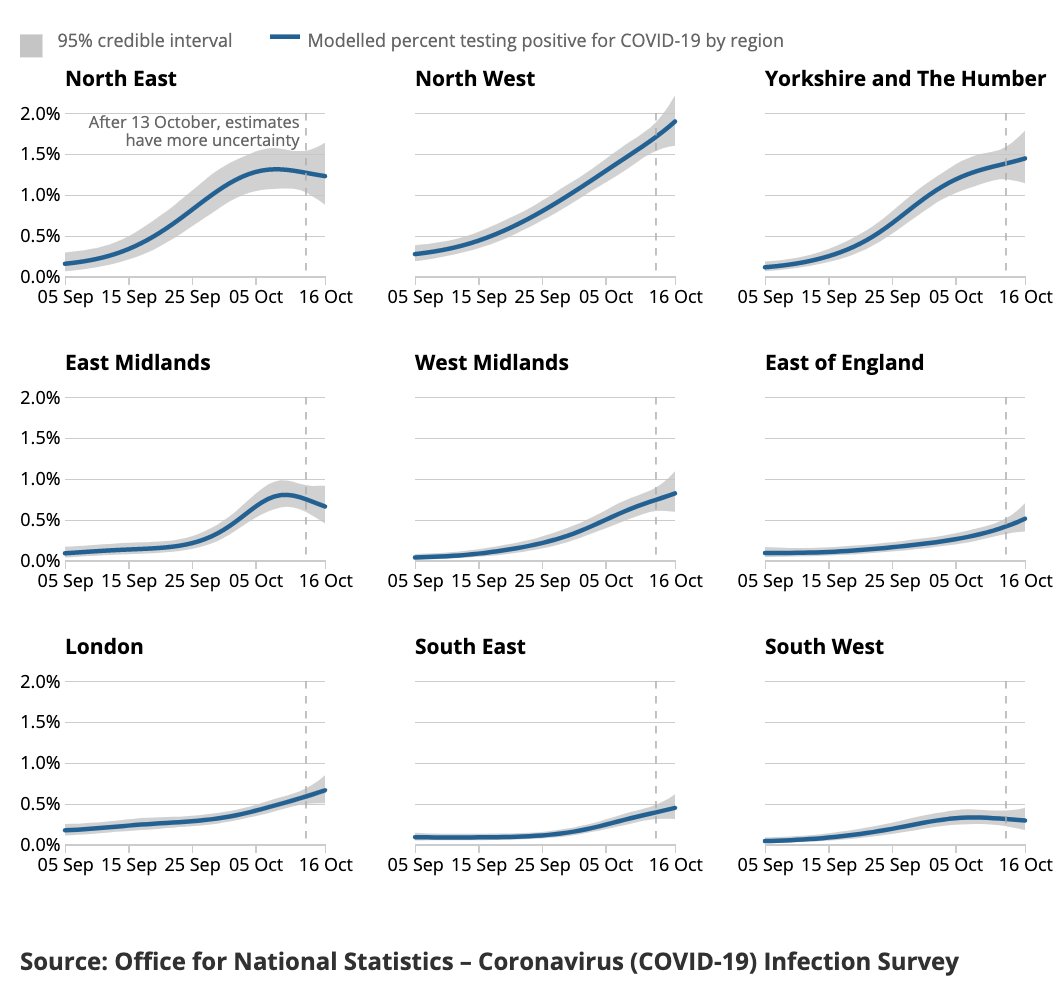
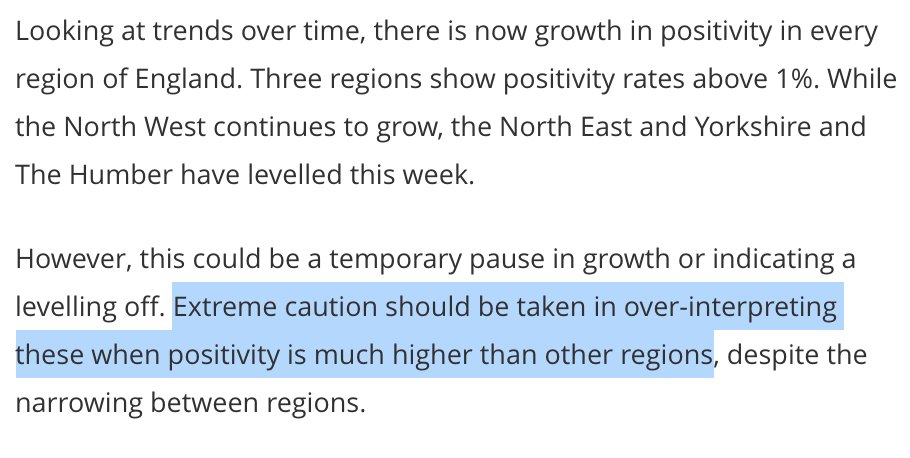
1a. ONS incidence
The headline is that during the most recent week (18 to 24 September) there were around 8,400 new infections per day not including those living in institutional settings, *down* from 9,600 previous week.
Still not rising in the elderly
ons.gov.uk/peoplepopulati…
The headline is that during the most recent week (18 to 24 September) there were around 8,400 new infections per day not including those living in institutional settings, *down* from 9,600 previous week.
Still not rising in the elderly
ons.gov.uk/peoplepopulati…


1b. Other incidence
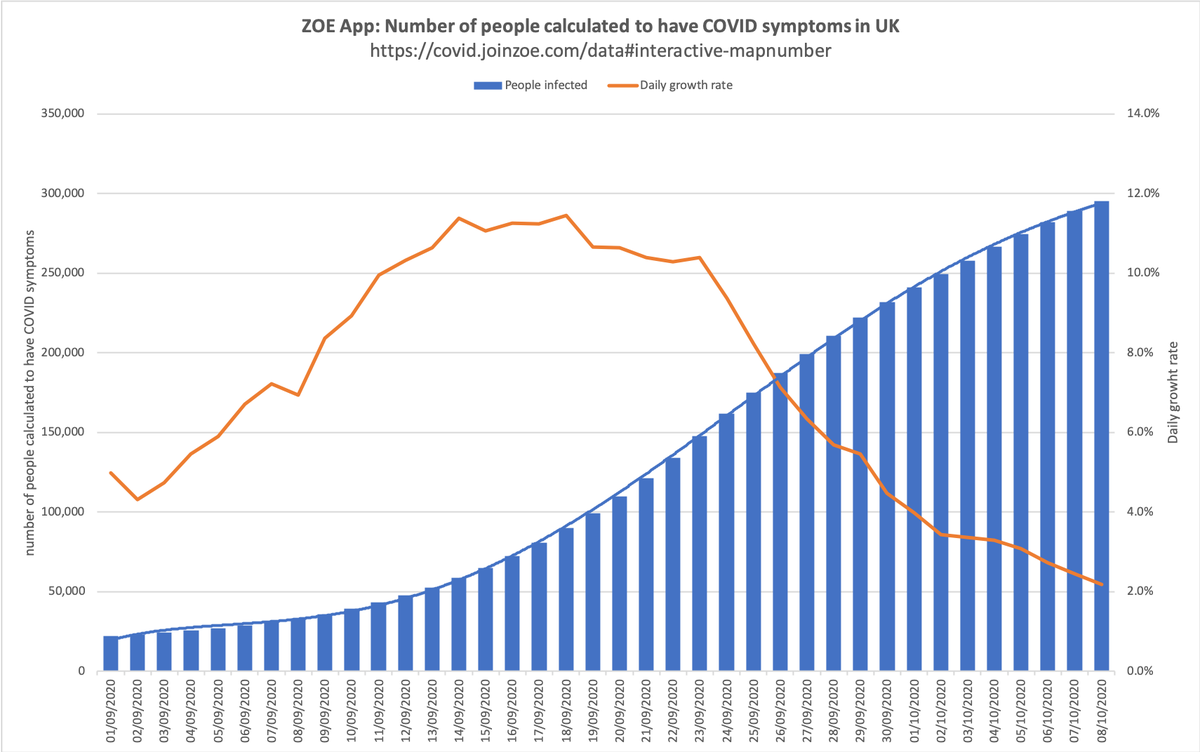
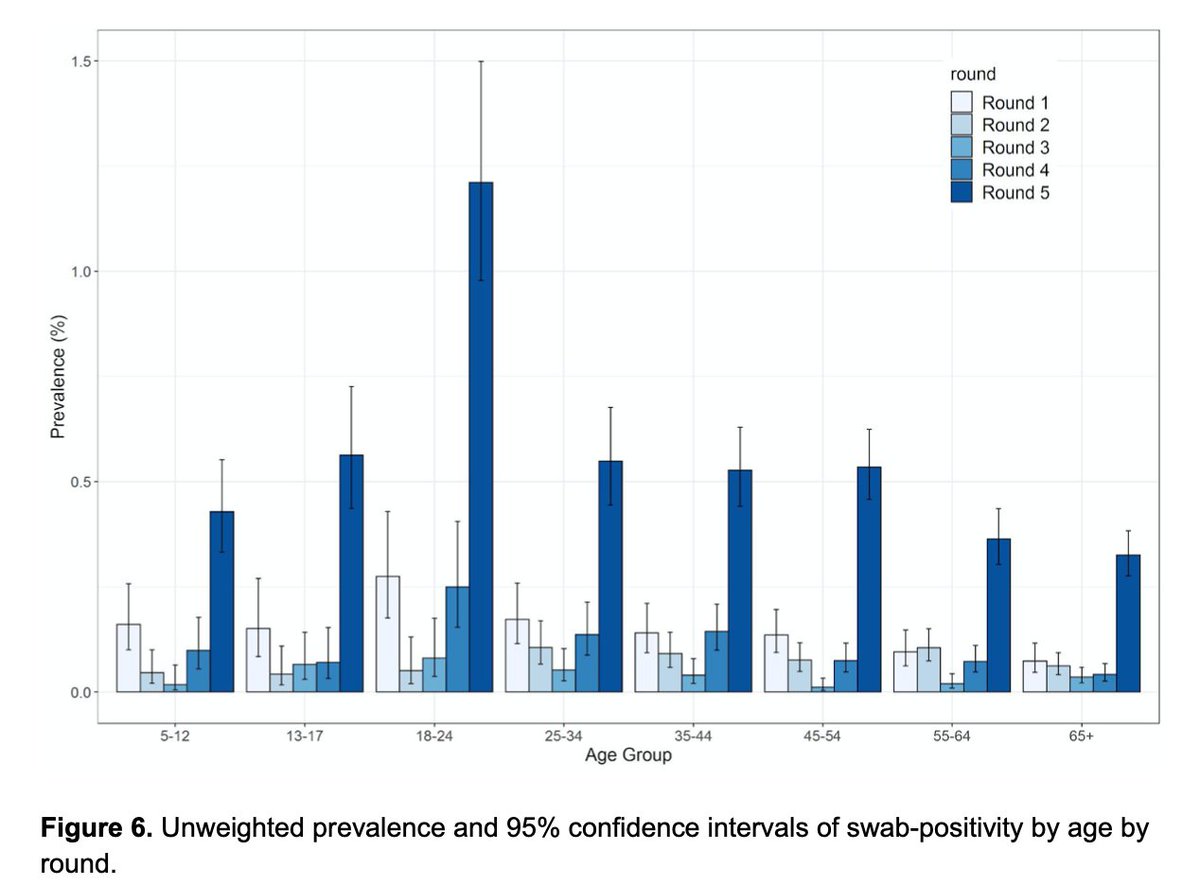
We also had the Imperial "REACT1" interim incidence report this week which also pointed to a slowdown, and the KCL Zoe app (tracking symptomatic cases) points in the same direction
imperial.ac.uk/media/imperial…
covid.joinzoe.com/data
We also had the Imperial "REACT1" interim incidence report this week which also pointed to a slowdown, and the KCL Zoe app (tracking symptomatic cases) points in the same direction
imperial.ac.uk/media/imperial…
covid.joinzoe.com/data


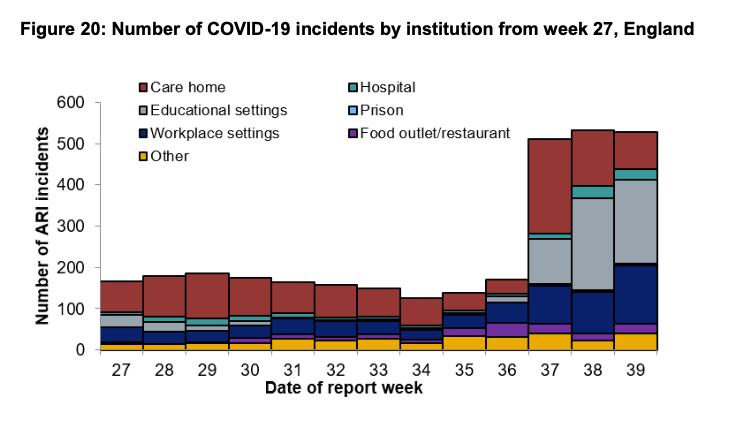
2. Care home outbreaks
Number of outbreaks down significantly in past fortnight, but still account for a significant % of institutional outbreaks (dwarfing hospitality).
Source: weekly PHE covid surveillance report, assets.publishing.service.gov.uk/government/upl…
Number of outbreaks down significantly in past fortnight, but still account for a significant % of institutional outbreaks (dwarfing hospitality).
Source: weekly PHE covid surveillance report, assets.publishing.service.gov.uk/government/upl…


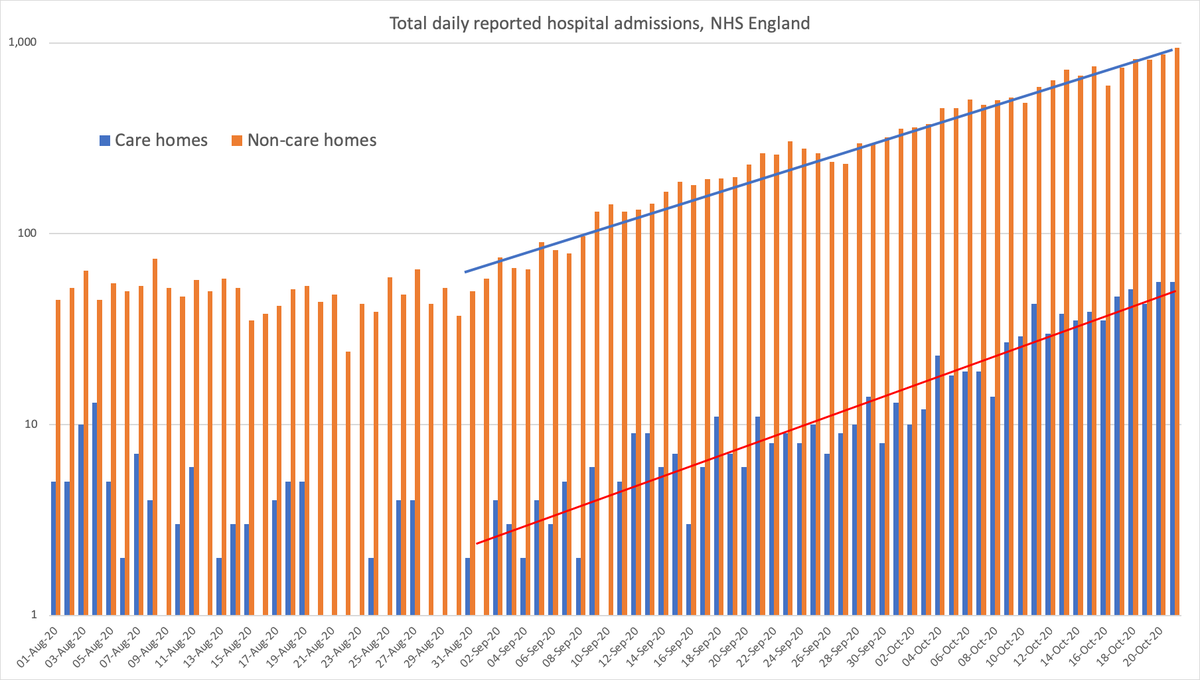
3. Hospitals
3a Hospital admissions and deaths
Covid deaths from NHS England stats: england.nhs.uk/statistics/sta…
Covid admissions: rising linearly (*not* exponentially), likely flattening
coronavirus.data.gov.uk/healthcare?are…
3a Hospital admissions and deaths
Covid deaths from NHS England stats: england.nhs.uk/statistics/sta…
Covid admissions: rising linearly (*not* exponentially), likely flattening
coronavirus.data.gov.uk/healthcare?are…


3b ICU admissions and Emergency Dept admissions
Extraordinary difference of ICU admission rates in different areas of the country, but nowhere remotely close to levels in spring.
Emergency admissions, again, levelling off.
Source: surveillance report
Extraordinary difference of ICU admission rates in different areas of the country, but nowhere remotely close to levels in spring.
Emergency admissions, again, levelling off.
Source: surveillance report


4. Covid triage
Online / phone 111 covid triage starting to return to normal after the back-to-school/college jump, but (critically) the pattern in vulnerable >70s shows the same pattern as incidence: higher levels than summer, but levelling off
digital.nhs.uk/dashboards/nhs…
Online / phone 111 covid triage starting to return to normal after the back-to-school/college jump, but (critically) the pattern in vulnerable >70s shows the same pattern as incidence: higher levels than summer, but levelling off
digital.nhs.uk/dashboards/nhs…


5. Cases
5a. Pillars 1&2 - last couple of weeks & last month (2nd wave) & full curve (bear in mind the left-hand side was heavily rationed for testing, the right-hand side *far* less so: the 'two waves' are not comparable).
Again, levelling off.
Source: coronavirus.data.gov.uk/cases?areaType…
5a. Pillars 1&2 - last couple of weeks & last month (2nd wave) & full curve (bear in mind the left-hand side was heavily rationed for testing, the right-hand side *far* less so: the 'two waves' are not comparable).
Again, levelling off.
Source: coronavirus.data.gov.uk/cases?areaType…


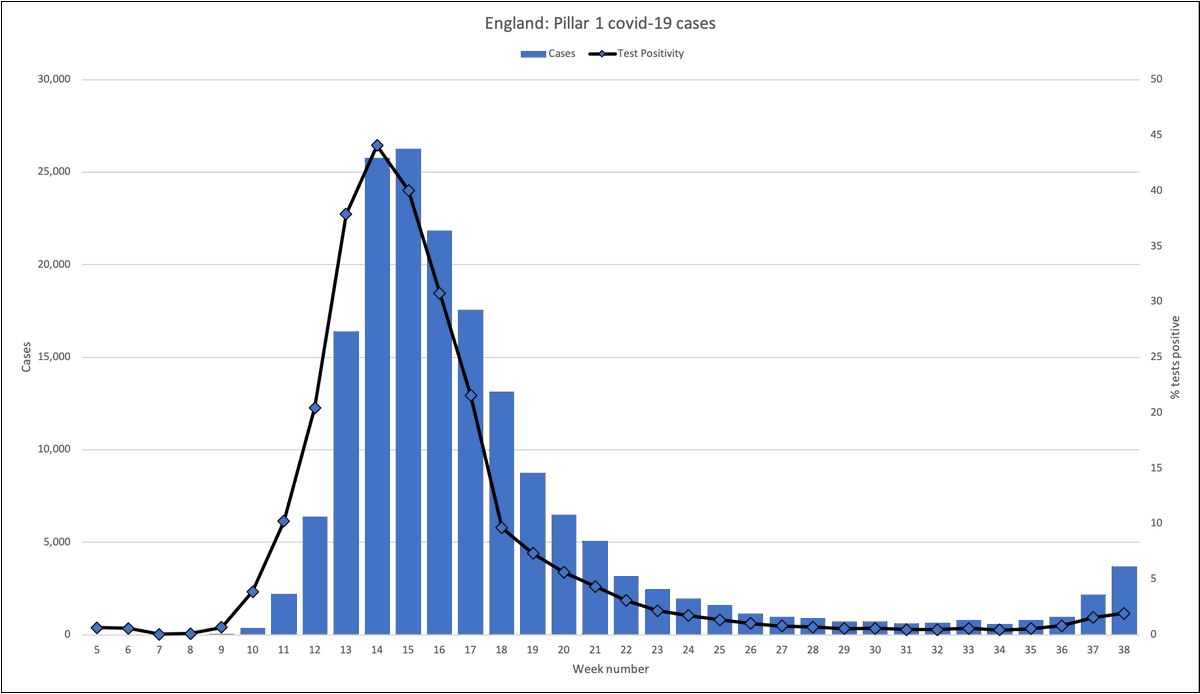
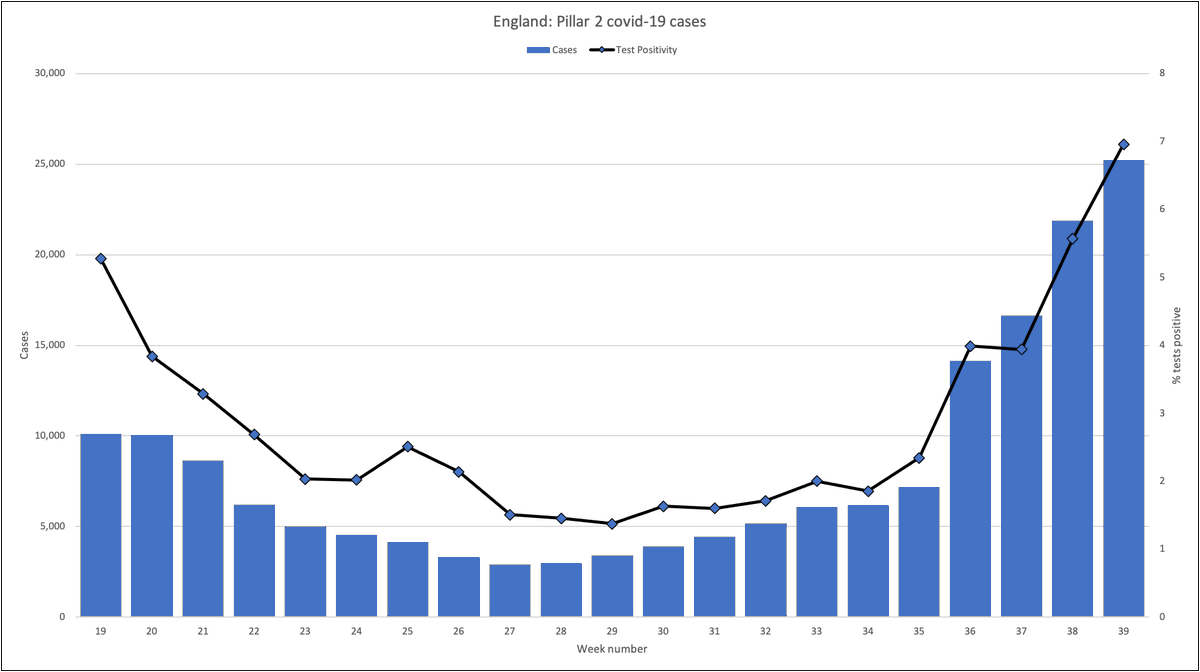
5b. Breakdown of pillar 1 (clinical need / NHS) and pillar 2 (community swab) cases and % positive. Again, the left-hand side was heavily rationed for testing, the right-hand side *far* less so.
Source: PHE covid surveillance report
Source: PHE covid surveillance report

6 Contact tracing
400k contacts now reached; assuming (per Smith et al paper) 10% have isolated as instructed, at a cost of £12bn that is £240k per isolation. Value?
Mostly our own housemates and guests, who we could tell anyway
assets.publishing.service.gov.uk/government/upl…
medrxiv.org/content/10.110…
400k contacts now reached; assuming (per Smith et al paper) 10% have isolated as instructed, at a cost of £12bn that is £240k per isolation. Value?
Mostly our own housemates and guests, who we could tell anyway
assets.publishing.service.gov.uk/government/upl…
medrxiv.org/content/10.110…


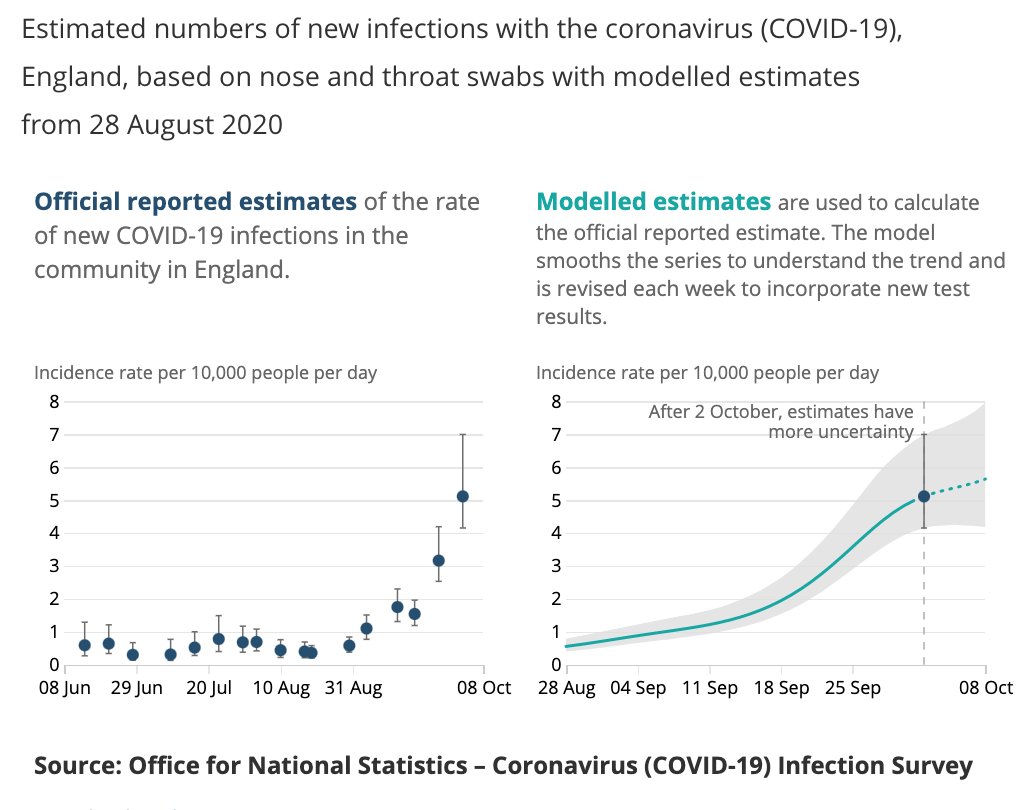
7 The Vallance-tracker
I'm going to drop this from future updates as it was a pointless and embarrassing thing for our CSO to have put in front of the media, and now looks snarky.
But note that the red line forecast (or whatever) is a mile away from blue line trend.
I'm going to drop this from future updates as it was a pointless and embarrassing thing for our CSO to have put in front of the media, and now looks snarky.
But note that the red line forecast (or whatever) is a mile away from blue line trend.

8 Mortality
Taking rolling last-12-months all-cause deaths, 2020 now doesn't look much more of an outlier above trend than 2019 was under trend.
Mortality has been at baseline since June.
Source: ONS and surveillance report, plus Euromomo: : euromomo.eu/graphs-and-maps
Taking rolling last-12-months all-cause deaths, 2020 now doesn't look much more of an outlier above trend than 2019 was under trend.
Mortality has been at baseline since June.
Source: ONS and surveillance report, plus Euromomo: : euromomo.eu/graphs-and-maps


9 Miscellaneous
9a Europe
Euromomo show deaths at baseline in all age-groups across Europe, Spain is the only country with above-average mortality
9a Europe
Euromomo show deaths at baseline in all age-groups across Europe, Spain is the only country with above-average mortality


9b Spain
Cases (dark green) and deaths (red) appear to have turned the corner; both are slowing. Poor Madrid looks to have had both a 2nd and 3rd wave.
Hospitalisations down 4 days on the trot, never growing exponentially.
mscbs.gob.es/profesionales/…
Cases (dark green) and deaths (red) appear to have turned the corner; both are slowing. Poor Madrid looks to have had both a 2nd and 3rd wave.
Hospitalisations down 4 days on the trot, never growing exponentially.
mscbs.gob.es/profesionales/…


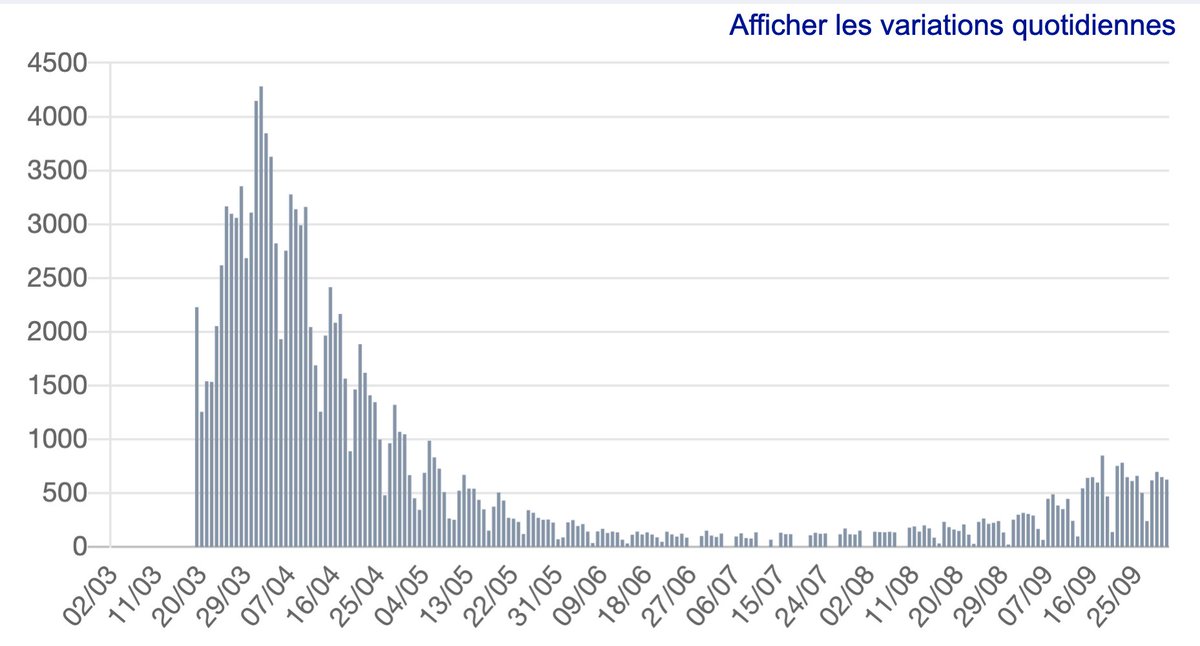
9c France
Covid hospitalisations seem to have turned the corner about a week ago
gouvernement.fr/info-coronavir…
Covid hospitalisations seem to have turned the corner about a week ago
gouvernement.fr/info-coronavir…
9d ICNARC
Updated ICU report published by ICNARC on the cohort of people being admitted to ICU during the 2nd wave, and outcomes *so far*
icnarc.org/DataServices/A…
Updated ICU report published by ICNARC on the cohort of people being admitted to ICU during the 2nd wave, and outcomes *so far*
icnarc.org/DataServices/A…
9e Papers
If you aren't covid-ed out, here's a couple of interesting old papers.
On the seasonality and mystery of flu, and why the best way to protect the vulnerable might be *not* to protect the healthy
virologyj.biomedcentral.com/articles/10.11…
ncbi.nlm.nih.gov/pmc/articles/P…
If you aren't covid-ed out, here's a couple of interesting old papers.
On the seasonality and mystery of flu, and why the best way to protect the vulnerable might be *not* to protect the healthy
virologyj.biomedcentral.com/articles/10.11…
ncbi.nlm.nih.gov/pmc/articles/P…
@threadreaderapp unroll please
• • •
Missing some Tweet in this thread? You can try to
force a refresh