
THREAD: Stock returns by category from Dec 1976 to Dec 2019 for MSCI US, Japan, Europe ex-UK and UK indices, each separated into growth, broad market and value. Description and discussion below, to include charts of different sub-periods. 
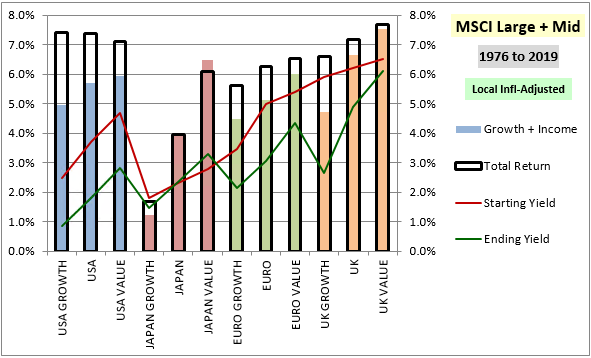
Empty black boxes represent total returns, colored columns represent fundamental returns (annualized dividend growth w/ all dividend payouts recast as share buybacks). When a box is higher (lower) than a column, it means the category grew more expensive (cheaper) over the period.
With charts like these, it's best to measure peak-to-peak. Dec 1976 was ~ a peak, Dec 2019 was ~ a peak. The chart below moves the end date to the left--Dec 1976 peak to Dec 1989 peak, the peak of the Nikkei bubble:

Equities everywhere got more expensive, but ROW much moreso than US. The absurd outlier was Japan. Its annual return from fundamentals (growth + income) was less than 1%, while its total return was > 15%. Over a 13 yr period! Difference was result of extreme multiple expansion.
In 1989's hindsight, US stocks appeared subpar relative to ROW. But strictly on fundamentals (growth + income), they outperformed. Their outperformance didn't translate into total return because they got cheaper on a relative basis. That left an opportunity for 1989 buyers.
The chart below shows the performance from the Dec 1989 peak to the Oct 2007 peak. I bypassed the tech bubble b/c it's not relevant to the point I want to make:

Note: By looking at inflation-adjusted local currency returns, the charts depict the real value capture that took place in those markets during the period. It removes the significant impacts of dollar appreciation/depreciation trends, which are not sustainable over the long-term.
Unsurprisingly, the performance inverted from the prior period. The US outperformed on total return despite underperforming on fundamentals, reflecting an upward revaluation relative to ROW. Japan corrected severely, suffering negative total returns despite positive fundamentals.
The chart below shows the last remaining period, the Oct 2007 peak to the Dec 2019 ~ peak:

Note: The depicted fundamental performance for Japan is distorted by the dividend payout ratio increases associated with Abenomics. If we were to measure growth in Japanese fundamentals using other aggregates (sales, earnings, etc.), the growth would not have been as strong.
US significantly outperformed ROW over the period. But most of that outperformance, particularly the component outside the growth segment, was due to significant downward revaluation of ROW markets (i.e., they got much cheaper). That's where the present opportunity may lie.
Now, to the point of the thread. DM rates are expected to remain at or below zero for a very long time. The question arises, how should equities be valued in such a world?
TINA thesis says they should be valued at very high multiples. If so, then there's a big inefficiency in JPN, EURO and UK mkts rn. High equity yields against zero/neg rates. If you're convinced by TINA, should have exposure there. Ideally ccy-hedged--capture the entire ERP.
But maybe the inefficiency is illusory, the result of poor expected future fundamentals. For whatever reasons, foreign companies don't deliver on the bottom line.
That could be true, but we need to recognize that the only *empirical* basis for it is the observation of the most recent 13-year period. It's fresher data, so it's privileged in that sense. But it's not reflected in the full historical experience.
Its rationale should not be "bad governance" or "bad capital allocation" or something else vague like that. Relative differences b/t the quality of US and ROW governance and capital allocation didn't change b/t 1976-2007 and 2007-2019 periods.
If something permanently changed b/t those periods to warrant abandonment of ROW investing, what is it? I can't think of any narrative other than tech/growth dominance. ROW is less exposed to it than US, & more exposed to "dying" industries, which could change the calculus.
I'll leave you w/ a particularly alarming chart--Dec 2017 peak to August 2020 peak.
(Note: empty positive boxes, with no color inside them, are bad. Things are getting more expensive):
(Note: empty positive boxes, with no color inside them, are bad. Things are getting more expensive):
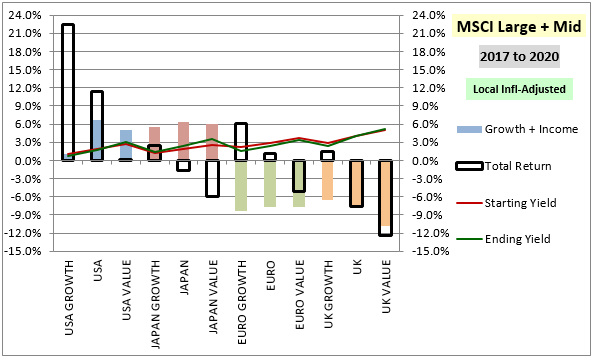
I find this chart alarming. For US growth, you have ~22% annualized total return with only ~1% of that coming from fundamentals, the rest from valuation expansion.
The other categories, especially ugly combinations of econ-sensitive value and ROW stocks, have an excuse: temporary earnings declines and dividend cuts due to C-19. But US growth, the epicenter of C-19 reorganization gains, obviously can't use that excuse.
I'd be uncomfortable w/ runup in US growth even if it were backed by strong trailing fundamentals, b/c those can mean-revert going fwd. But I'm not even seeing much of that--move seems to be nothing but huge upward revaluation.
To put the point bluntly, I think we're being collectively gaslighted by the price action here, & by these irresistible stories of permanently-altered, competition-immune, hyper-profitable future landscapes. Kill Covid and this segment is going to have problems.
• • •
Missing some Tweet in this thread? You can try to
force a refresh


