
day 16. getting real data #100DaysOfCode data analysis w/ python #freeCodeCamp
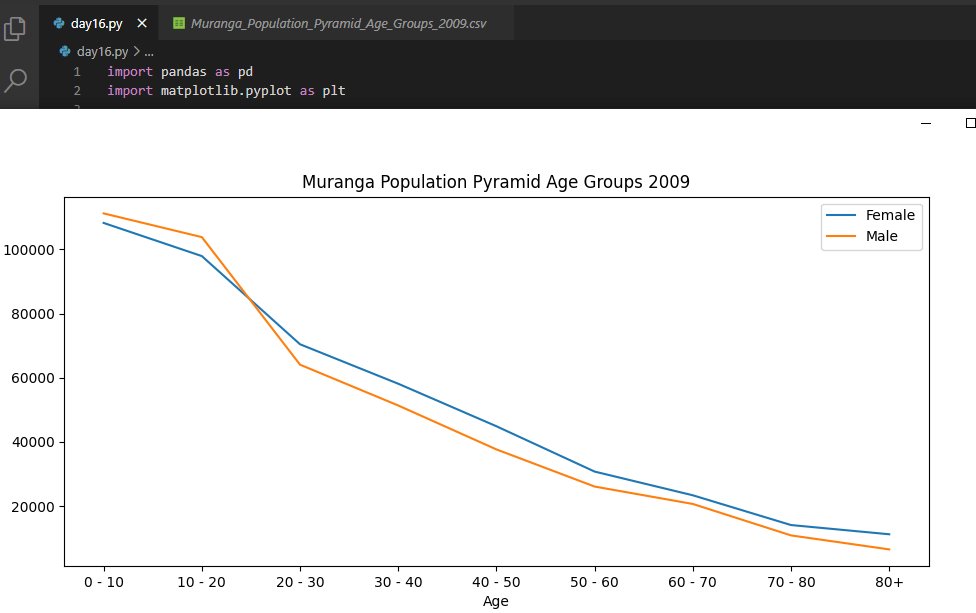
#Muranga population from way back, but these things don't change that often😂
#Muranga population from way back, but these things don't change that often😂
In Homa Bay, the curve is almost a fine shape ;), as time goes by, the female population overtakes it. Maybe marriage brings more women in? Or men just disappear?

What sorcery is this, even in Nyeri its more females ending up past 30 than males. But the population starts with a higher male figure(almost always). We have to try more counties to be sure 😱

Here's a a hint into a theory, Taita Taveta looks very different but the story is the same, more males initially, more females 'finally', time to try Migori!

Found it! Same story, Im close to a theory ;)

Narok, same tale!

All in all, the drop from 20-30 age-group in Homa Bay is the strangest. #100DaysOfCode
🎶 hoist the colors high 😂
@charlesodondi7 anything on this population drop?
🎶 hoist the colors high 😂
@charlesodondi7 anything on this population drop?

All data was from opendata.go.ke/datasets/
• • •
Missing some Tweet in this thread? You can try to
force a refresh


