Half year 2020 States Internally Generated Revenue Report published @ nigerianstat.gov.ng/download/1167: Total 2020 Half year IGR: -11.77% Year on Year(Jan- July 2019 vs Jan -July 2020) 


Half year 2020 States Internally Generated Revenue Report published @ nigerianstat.gov.ng/download/1167:
Abia H1 2020 was -21.8% Year on Year
Adamawa H1 2020 was -25.2% Year on Year
Akwa Ibom H1 2020 was -20.8% Year on Year
Anambra H1 2020 was +9.9% Year on Year
Abia H1 2020 was -21.8% Year on Year
Adamawa H1 2020 was -25.2% Year on Year
Akwa Ibom H1 2020 was -20.8% Year on Year
Anambra H1 2020 was +9.9% Year on Year


Half year 2020 States Internally Generated Revenue Report @ nigerianstat.gov.ng/download/1167:
Bauchi H1 2020 was -30.4% Year on Year
Bayelsa H1 2020 was -8.3% Year on Year
Benue H1 2020 was -55.9% Year on Year
Borno H1 2020 was +37.3% Year on Year
Bauchi H1 2020 was -30.4% Year on Year
Bayelsa H1 2020 was -8.3% Year on Year
Benue H1 2020 was -55.9% Year on Year
Borno H1 2020 was +37.3% Year on Year


Half year 2020 States Internally Generated Revenue Report @ nigerianstat.gov.ng/download/1167:
Cross River H1 2020 was -51.9% Year on Year
Delta H1 2020 was -15.2% Year on Year
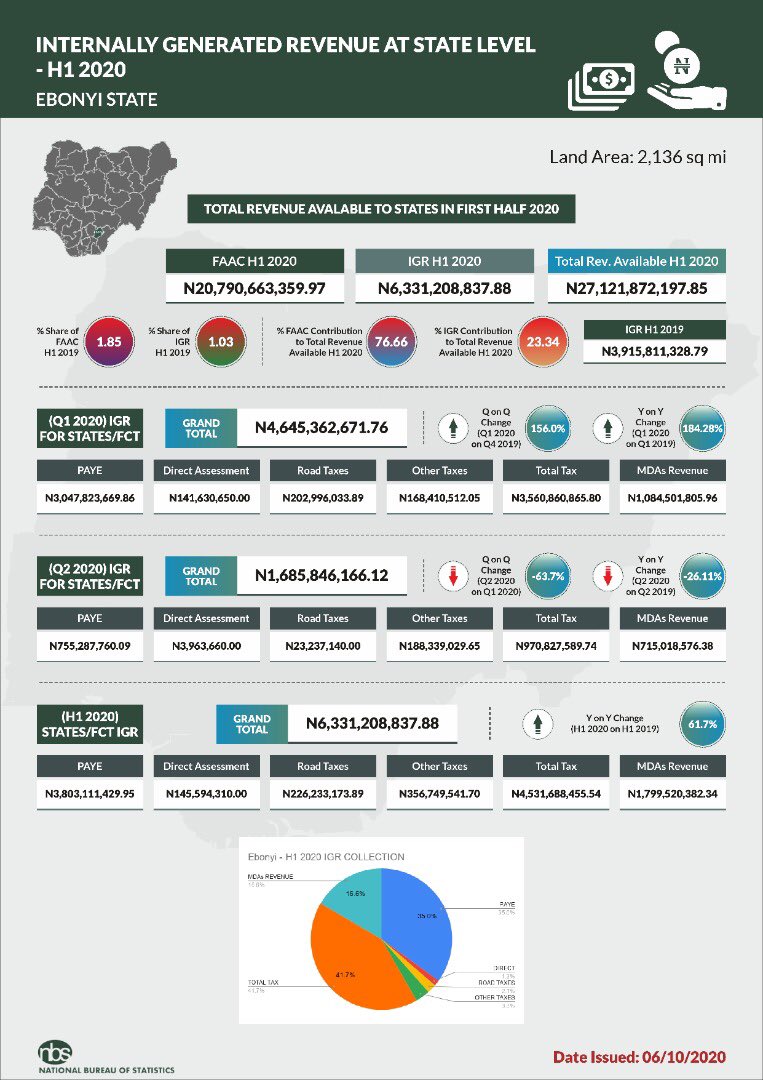
Ebonyi H1 2020 was +61.7% Year on Year
Edo H1 2020 was -9.2% Year on Year
Cross River H1 2020 was -51.9% Year on Year
Delta H1 2020 was -15.2% Year on Year
Ebonyi H1 2020 was +61.7% Year on Year
Edo H1 2020 was -9.2% Year on Year


Half year 2020 States Internally Generated Revenue Report @ nigerianstat.gov.ng/download/1167:
Ekiti H1 2020 was -3.8% Year on Year
Enugu H1 2020 was +14.6% Year on Year
Gombe H1 2020 was 81.5% Year on Year
Imo H1 2020 was -26.7% Year on Year
Ekiti H1 2020 was -3.8% Year on Year
Enugu H1 2020 was +14.6% Year on Year
Gombe H1 2020 was 81.5% Year on Year
Imo H1 2020 was -26.7% Year on Year


Half year 2020 States Internally Generated Revenue Report @ nigerianstat.gov.ng/download/1167:
Jigawa H1 2020 was -44.0% Year on Year
Kaduna H1 2020 was -42.5% Year on Year
Kano H1 2020 was -5.7% Year on Year
Katsina H1 2020 was +15.2% Year on Year
Jigawa H1 2020 was -44.0% Year on Year
Kaduna H1 2020 was -42.5% Year on Year
Kano H1 2020 was -5.7% Year on Year
Katsina H1 2020 was +15.2% Year on Year


Half year 2020 States Internally Generated Revenue Report @ nigerianstat.gov.ng/download/1167:
Kebbi H1 2020 was -30.4% Year on Year
Kogi H1 2020 was +11.2% Year on Year
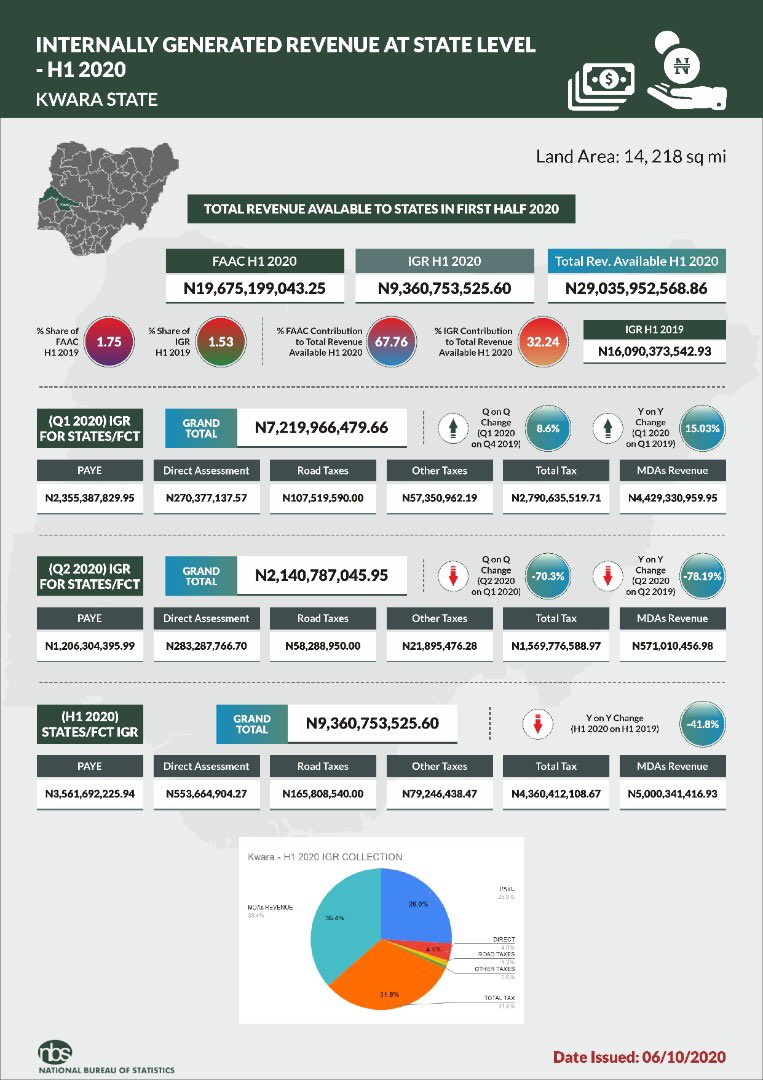
Kogi H1 2020 was -41.8% Year on Year
Lagos H1 2020 was -0.3% Year on Year
Kebbi H1 2020 was -30.4% Year on Year
Kogi H1 2020 was +11.2% Year on Year
Kogi H1 2020 was -41.8% Year on Year
Lagos H1 2020 was -0.3% Year on Year


Half year 2020 States Internally Generated Revenue Report @ nigerianstat.gov.ng/download/1167:
Nasarawa H1 2020 was +21.9% Year on Year
Niger H1 2020 was -56% Year on Year
Ogun H1 2020 was -19.9% Year on Year
Ondo H1 2020 was -28.5% Year on Year
Nasarawa H1 2020 was +21.9% Year on Year
Niger H1 2020 was -56% Year on Year
Ogun H1 2020 was -19.9% Year on Year
Ondo H1 2020 was -28.5% Year on Year


Half year 2020 States Internally Generated Revenue Report @ nigerianstat.gov.ng/download/1167:
Osun H1 2020 was -14.0% Year on Year
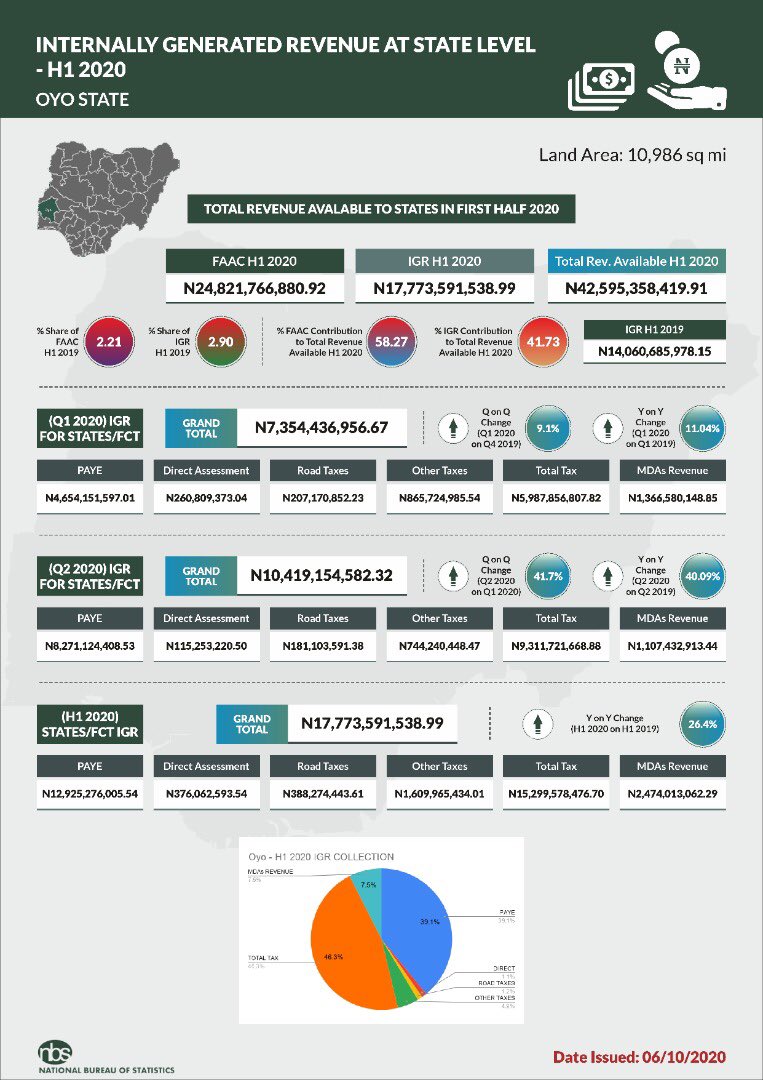
Oyo H1 2020 was +26.4% Year on Year
Plateau H1 2020 was -0.1% Year on Year
Rivers H1 2020 was -15.0% Year on Year
Osun H1 2020 was -14.0% Year on Year
Oyo H1 2020 was +26.4% Year on Year
Plateau H1 2020 was -0.1% Year on Year
Rivers H1 2020 was -15.0% Year on Year


Half year 2020 States Internally Generated Revenue Report @ nigerianstat.gov.ng/download/1167:
Taraba H1 2020 was +24.1% Year on Year
Yobe H1 2020 was +77.8% Year on Year
Sokoto H1 2020 was -61.9% Year on Year
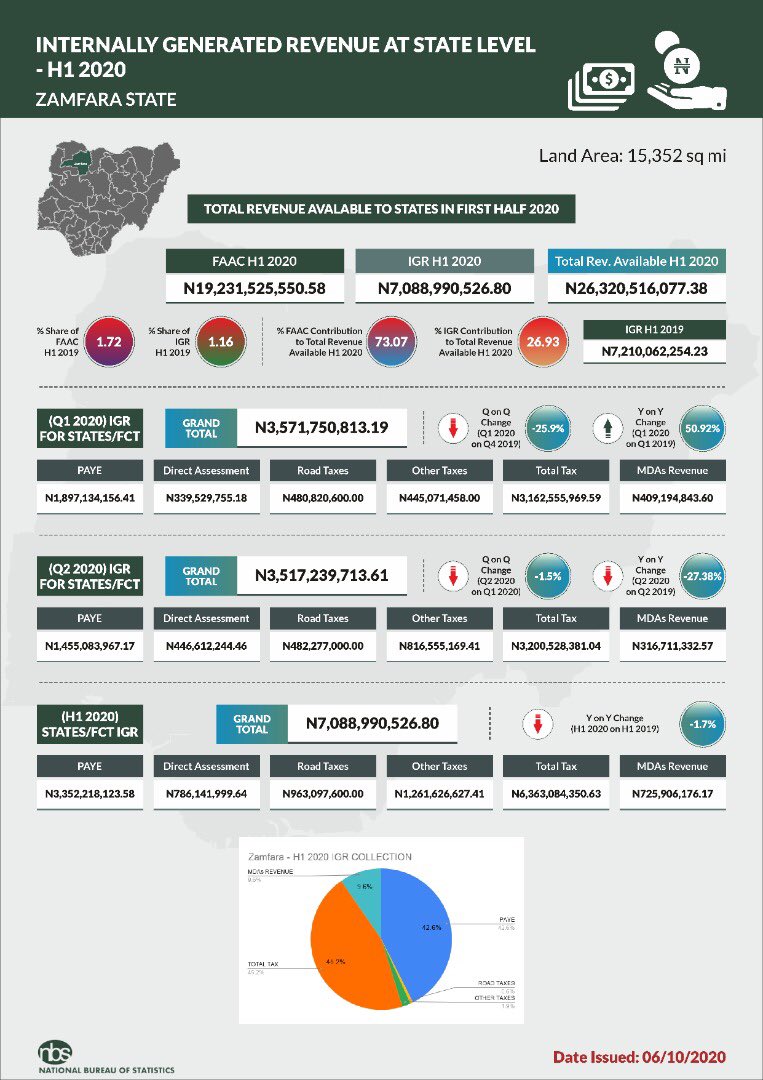
Zamfara H1 2020 was -1.7% Year on Year
Taraba H1 2020 was +24.1% Year on Year
Yobe H1 2020 was +77.8% Year on Year
Sokoto H1 2020 was -61.9% Year on Year
Zamfara H1 2020 was -1.7% Year on Year


Half year 2020 States Internally Generated Revenue Report @ nigerianstat.gov.ng/download/1167:
FCT H1 2020 was -8.7% Year on Year
FCT H1 2020 was -8.7% Year on Year

• • •
Missing some Tweet in this thread? You can try to
force a refresh