Is Trump the Infecter in Chief? Here is a plausible scenario based on public data (link at end). Sept 24th, Ronna McDaniel, who does not know she is positive, travels with Trump to Charlotte and infects him. On the 26th she finds out she is a contact and isolates. 1/
Two days later he hosts two events at the White House, the Gold Star military family event, where he infects an Admiral, and the Barrett nomination where he infects about 10 including three senators, a sitting governor, and a university president. 2/
Four more at debate prep the next day which was reported in a small, poorly ventilated, room. 3/
On Wednesday he feels lethargic. Ronna McDaniel finds out she is positive and notifies the White House, so Trump at this point knows for certain he is a probable contact. He goes to New Jersey and Minnesota anyway. 4/
Thursday night he reports his test results. 34 total positives at this point. Many many others in isolation. Data from 5/5 public.tableau.com/profile/peter.…

• • •

Missing some Tweet in this thread? You can try to force a refresh
 

Keep Current with Dave Blake, PhD

Dave Blake, PhD Profile picture

Stay in touch and get notified when new unrolls are available from this author!

Read all threads

This Thread may be Removed Anytime!

PDF

Twitter may remove this content at anytime! Save it as PDF for later use!

Try unrolling a thread yourself!

how to unroll video
  1. Follow @ThreadReaderApp to mention us!

  2. From a Twitter thread mention us with a keyword "unroll"
@threadreaderapp unroll

Practice here first or read more on our help page!

More from @_stah

6 Oct
The CO2 report from school one. Most of the rooms in school were reading ~800 with students in them, maybe some up to 900. 1/
An outside trailer used as a teacher office was at 3000 ppm CO2. It dropped to 600 within 5 minutes of windows/doors being left open. Classrooms were also really responsive to opening windows on opposite sides. 2/
Even events in the gym did not really get CO2 higher, but windows and doors open could drop CO2 in any room relatively quickly. Windows and doors in common use buildings, people. Windows and doors. 3/
Read 4 tweets
5 Oct
Before drive to work Image
Hit 1000 ppm in 8 minutes and is now being at me. One passenger.. Mid size sedan. Image
Stable at 17 minutes. Will try one window down 3 inches. Image
Read 4 tweets
27 Sep
More data on schools in GA. I am trying to do comparisons that are reasonably near each other geographically, and have a difference in virtual vs in-person school. First up, Gwinnett (Aug start school) vs Dekalb Co. (virtual) 1/
Second up, our coastal region. Chatham Co is virtual, while Effingham,Bryan,Liberty,Mcintosh,Glynn have some in person options with varied Aug start dates. Will try to add more to this today. 2/
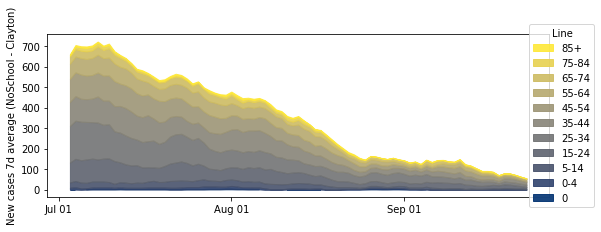
Clayton County, no school. Fayette County with a Aug 17 start. (note: population of Clayton is larger).
Read 7 tweets
25 Sep
The SCHOOL EFFECT: first pass. First, I tried to bait @tjmule into doing this, but he would not bite. So you are stuck with me. How does having school impact transmission - a first pass. 1/
School systems are a lot of contacts. In my county, the school system enrolls one of each six people (not counting staff). That's a lot of people moving around, and in infectious disease, that really matters. I found an older list of counties with, and without k-12 schools. 2/
Here is the list I used. If someone has a better list, please point me to it!!!! It also matters. I only used counties, because the state indexes cases by counties. I omitted counties where I know there are large college breakouts (Clarke, Lumpkin and a few others). 3/
Read 8 tweets
25 Sep
Rt vs percent infected, and Cases per Fatality vs percent infected, for all 50 states. Faint lines on the Cases per Fatality plot are isocountours of equal disease burden, and are spaced apart at 2x changes in burden. A methods thread 1/ ImageImage
For these plots, percent currently infected is 3.8 times the number of new cases in the past 10 days. 3.8x is the difference between national CFR and CDC claimed IFR. It is an estimate scaled from cases per capita. 2/
Rt is a 10 day windowed sum of new cases, ratioed to a similar sum 14 days earlier, and then pro-rated to a 5.2 day period. A 6.5-7.5 day period would be better, but I am staying consistent and using an April number. 3/
Read 9 tweets
9 Sep
A thread on the Sturgis study. I want to focus on one point - how can they find 266k cases are linked to Sturgis? Here is the study. 1/ ftp.iza.org/dp13670.pdf
Counties were categorized in terms of their inflow of pings to Sturgis. How many cell-phone pings (of origin in that county) occurred in Sturgis during the festival, compared to the prior two weeks? There were five different levels of inflow, in descending order. 2/
Next, relative, and absolute, high to low inflow counties had the LOG of their COVID19 cases plotted by weeks. All three of the highest ping county groups has increases starting about three weeks after the event. Low ping county groups had decreases. Changes were significant. 3/
Read 12 tweets

Did Thread Reader help you today?

Support us! We are indie developers!


This site is made by just two indie developers on a laptop doing marketing, support and development! Read more about the story.

Become a Premium Member ($3/month or $30/year) and get exclusive features!

Become Premium

Too expensive? Make a small donation by buying us coffee ($5) or help with server cost ($10)

Donate via Paypal Become our Patreon

Thank you for your support!

Follow Us on Twitter!