You’ve probably heard about test positivity—a powerful metric that can reveal the percentage of COVID-19 tests coming back positive. This metric comes with some pretty big caveats. Let’s break them down: covidtracking.com/blog/test-posi…
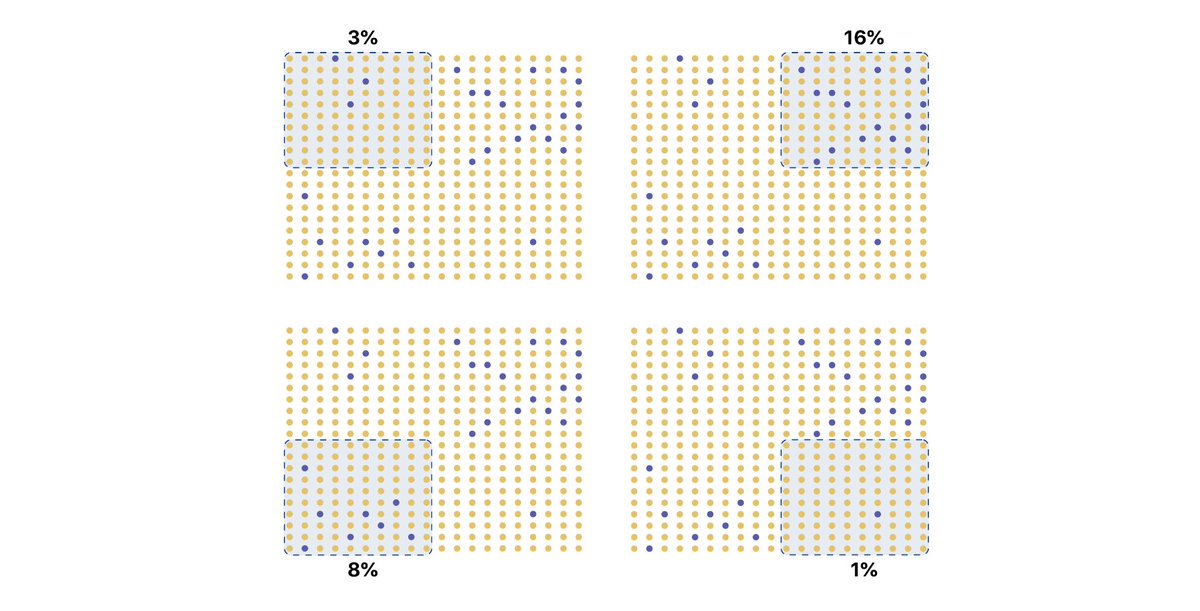
The first disclaimer is that test positivity reflects the % of people tested who have the virus, but not necessarily the % of people in the entire population who have the virus. So this metric only shows a portion of reality. covidtracking.com/blog/test-posi…
This makes it very tricky to make good assumptions based on test positivity, as it changes depending on who gets tested. Here, if different groups of people were tested, our numbers would vary anywhere from 1 to 16%, even though the total number of infections is the same.
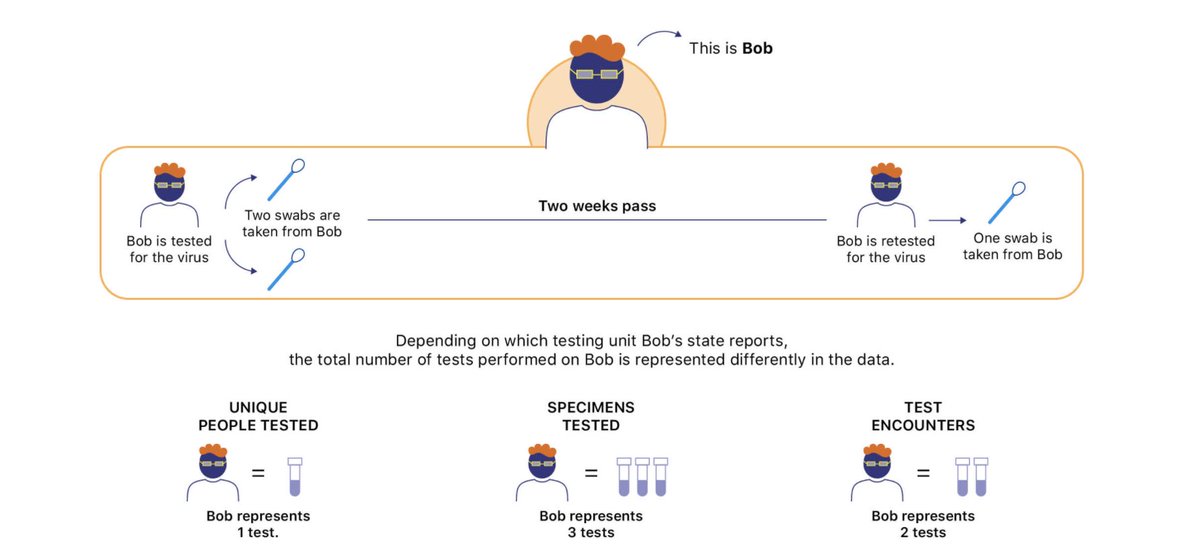
It gets EXTRA complicated when we look at the many ways jurisdictions report total tests (the denominator for test positivity). Each total-tests metric counts people differently in the data, which changes positivity. covidtracking.com/blog/test-posi…
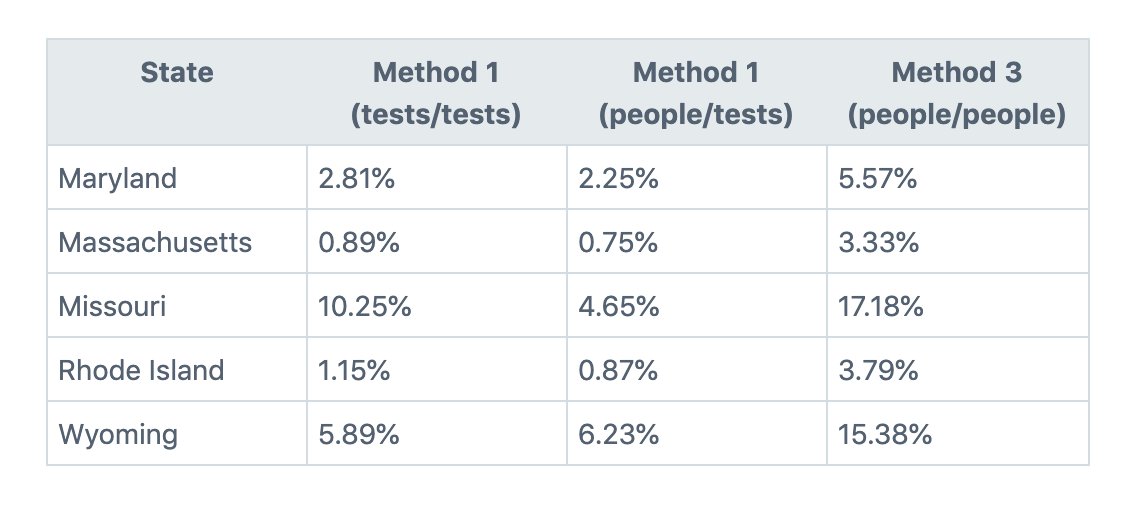
Not only are the units confusing, the formulas for calculating test positivity also vary. We did the math for five states using three methods validated by the CDC and the results are wildly divergent.
Until every state reports this most basic COVID-19 data in the same way, direct test positivity comparisons across states will remain an intractable problem. For that reason—because test positivity rates cannot easily be standardized—we do not currently publish them.
What we can do, however, is bring these complexities and inconsistencies into the light. To that end, we’ve recently made several changes to the way we display and distribute total tests data. We explain these changes here: covidtracking.com/blog/counting-…
No single measure of the US public health response to COVID-19 should be considered in isolation, and this is especially true of test positivity. We recommend against an over-reliance on test positivity calculations to justify changes in public health responses or policies.
• • •
Missing some Tweet in this thread? You can try to
force a refresh
Our daily update is published. States reported 1.1 million tests, 58k cases, 35k currently hospitalized, and 904 COVID-19 deaths. Today's case count is the highest since August 7.
We continue our rolling updates to the metrics tracked in our original totalTestResults API field. We updated test metrics for Hawaii today, resulting in a ~3.4k increase in daily new tests and a ~131k cumulative increase. Follow our progress here: covidtracking.com/about-data/tot…
The rise today is due to switching Hawaii’s test units in totalTestResults from positive + negative unique people tested to directly reported test encounters, in accordance with our policy explained in detail here covidtracking.com/blog/counting-…
Our daily update is published. States reported 1 million tests, 55k cases, and 975 deaths. 34k people are currently hospitalized with COVID-19. WI, ND, UT and WY reported record high case counts today.
Missouri added current hospitalizations back to their dashboard, so we updated this metric in our data. Today’s hospitalization count—1,344—was MO’s highest ever.
Starting today, we are displaying a breakdown of confirmed and probable cases on our site for any state where the data is available. We are also releasing a new field, probableCases, in our API. In most states, this data goes back to April 29.
Our daily update is published. States reported 851k tests, 51k cases, and 916 deaths. Montana and South Dakota both hit record high COVID-19 case counts today.
States reported 32k patients are currently hospitalized with COVID-19. Trends in the midwest, particularly in Wisconsin, are worrisome.
A note for Missouri data: today, we continue our changes to the values in our original totalTestResults API field, resulting in a ~8k increase in daily new tests and a ~579k cumulative increase.
Michigan reports a disproportionate amount of COVID-19 cases and deaths among Black people. But state-level data does not reveal the ways COVID-19 is impacting local communities. To track this, @COVID19Tracking has followed a few cities since end of May. covidtracking.com/blog/state-lev…
Tracking city-level data allows us to see that 48% of Black people who have died from COVID-19 in Michigan are from Detroit. But the decisions that individual jurisdictions make can obscure the scale of this impact.
Wayne County is Michigan’s most populous county. Its data for August 5 shows 13% of the state’s deaths among Black people came from Wayne County. But the county’s data excludes Detroit, which represents 38% of the county’s population.
We are in the process of changing the total test results in our original totalTestResults API field for each state from positive+negative to directly reported totals, one state at a time, preferring Test Encounters or Specimens as the unit for total tests. covidtracking.com/blog/counting-…
Where possible, we now use states’ “Test Encounters” or “Specimens” as the unit for these total tests, rather than “Unique People.” (This is all fairly complicated, there’s tons of detail in the blog post.) So far, we’ve switched CO, MA, ND, and RI w/ many more on deck.
Today, we updated our *national* totalTestResults API field to follow the same logic. Our daily new-test increase numbers are affected only slightly (~8%) today, but the US *cumulative* testing totals in the US totalTestResults field went up ~2M tests.