A summary of the slides from today's @IndependentSage briefing.
Slides prepared by the brilliant @chrischirp.
First up testing has stayed relatively flat for the last couple of weeks. Not ramping up like we might hope. Only rising Significantly in NI.
Slides prepared by the brilliant @chrischirp.
First up testing has stayed relatively flat for the last couple of weeks. Not ramping up like we might hope. Only rising Significantly in NI.

The proportion of tests being returned promptly is dropping in almost all settings (bad) but rising in care homes (good).

Confirmed cases still rising steeply. Cases delayed by Excelgate earlier in the week have been spread evenly over the days when data was missing.

Number of cases per head of population rising in all nations. Particularly quickly in Northern Ireland.

Number of new cases broken down by local authority. North clearly showing large numbers of new cases, but so too the midlands and some areas further souther. Infection is rising almost everywhere.

Number of cases per 100,000 by region. Highest and rising sharply in the NW, NE+Yorshire.
Cut of between rumoured tier one and tier two restrictions being brought in is allegedly 100 per 100,000 putting NW, NE+Yorkshire straight into tier one. Midlands close behind.
Cut of between rumoured tier one and tier two restrictions being brought in is allegedly 100 per 100,000 putting NW, NE+Yorkshire straight into tier one. Midlands close behind.

As usual (and perhaps obvious) rises in cases not due to rise in testing. Proportion of tests coming back positive is rising in all regions.

Confirms what we're seeing in the from King’s College symptom tracker app suggesting a doubling time of two weeks.

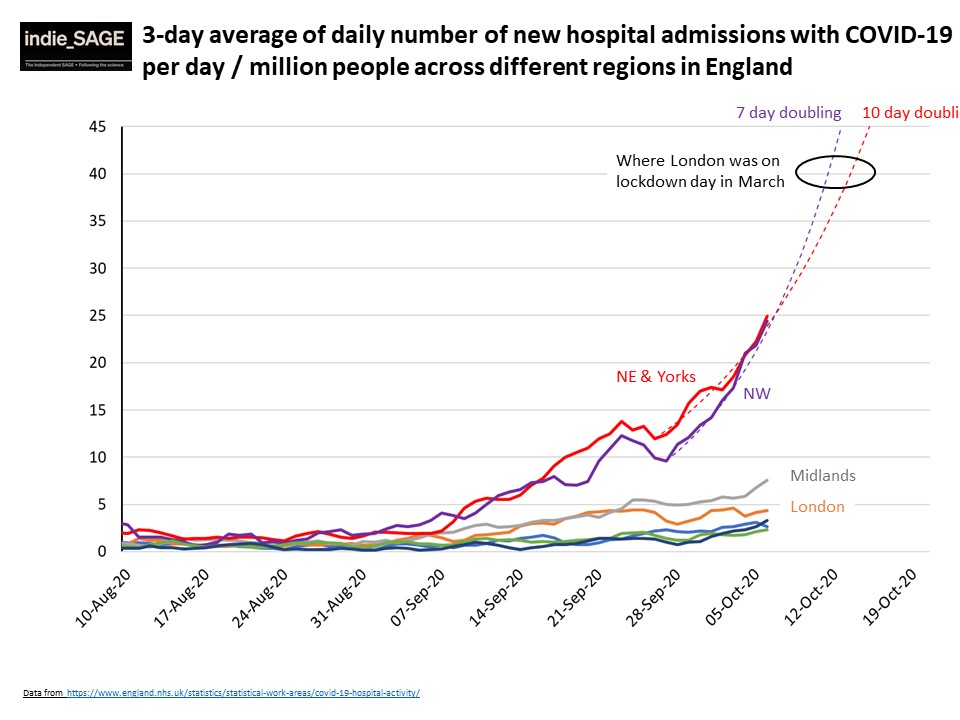
Hospital admission doubling times also appearing to rise back to every two weeks up from perhaps doubling every 18 days last week.

Daily hospital admissions rising quickly, especially in NW and NE+Yorkshire, doubling every 7 - 10 days respectively.
At this rate we are not far from reaching capacity in these regions.
At this rate we are not far from reaching capacity in these regions.
Deaths also continuing to rise: 234 for week ending 25th September up from 139 for week ending 18th September.

Huge increases in the proportion of teenagers testing positive 10-19 is the fastest growing age group, likely driven by universities.

UK cases over-taking Spain and France. We no longer appear to be on the same trajectory, but just a little behind the curve. We are now ahead of the curve, indeed defining the curve.

Similar picture with hospitalisations just slightly lagged as we would expect. UK looks set to overtake France and has already overtaken Spain.

Finally some suggestion for how to get us out of this mess @IndependentSage .
The government urgently needs to halt and reverse growth by:
- Introducing additional temporary restrictions, that are clearly communicated and transparent with clear criteria for exit. ...
The government urgently needs to halt and reverse growth by:
- Introducing additional temporary restrictions, that are clearly communicated and transparent with clear criteria for exit. ...
- Supporting households to isolate if they have COVID-19 or are a close contact
- Supporting businesses and those whose livelihoods are impacted to weather this period
- Increasing test capacity and turnaround times
- Redesigning and improving contact tracing
Act now, Save lives
- Supporting businesses and those whose livelihoods are impacted to weather this period
- Increasing test capacity and turnaround times
- Redesigning and improving contact tracing
Act now, Save lives
• • •
Missing some Tweet in this thread? You can try to
force a refresh