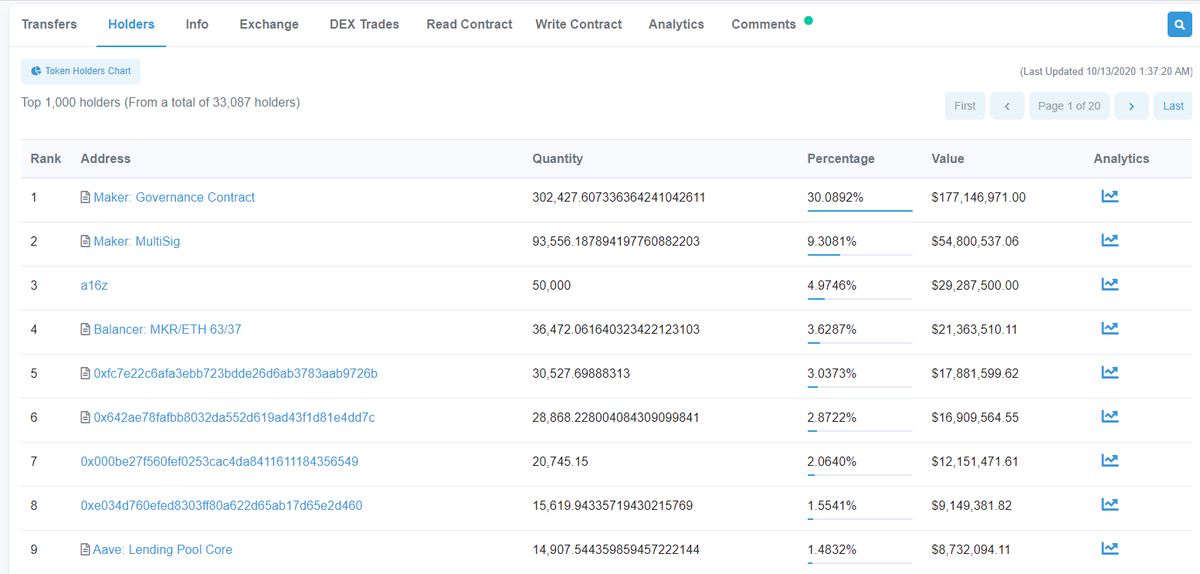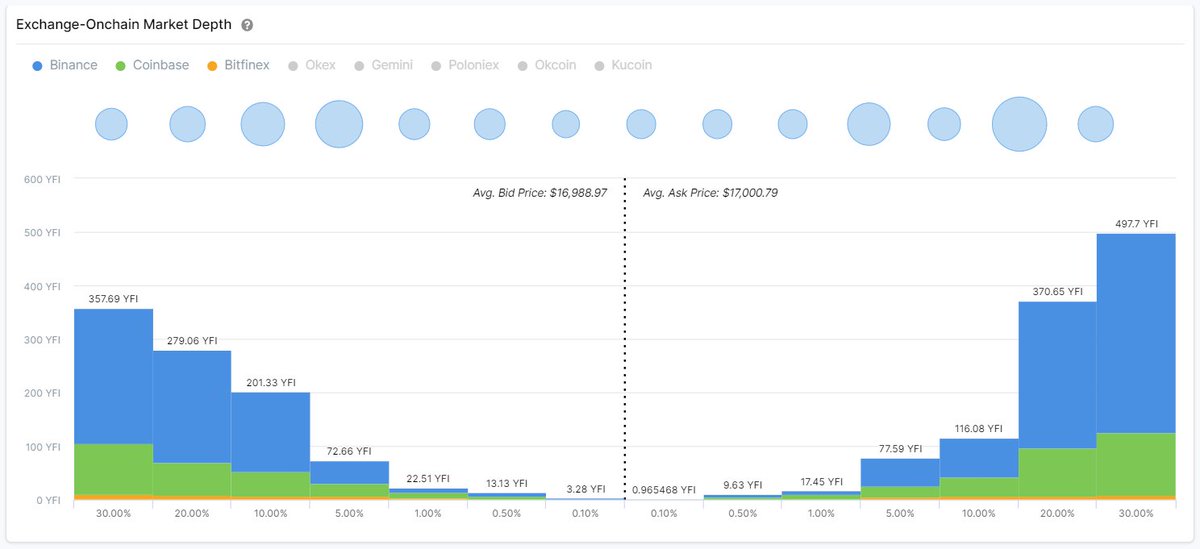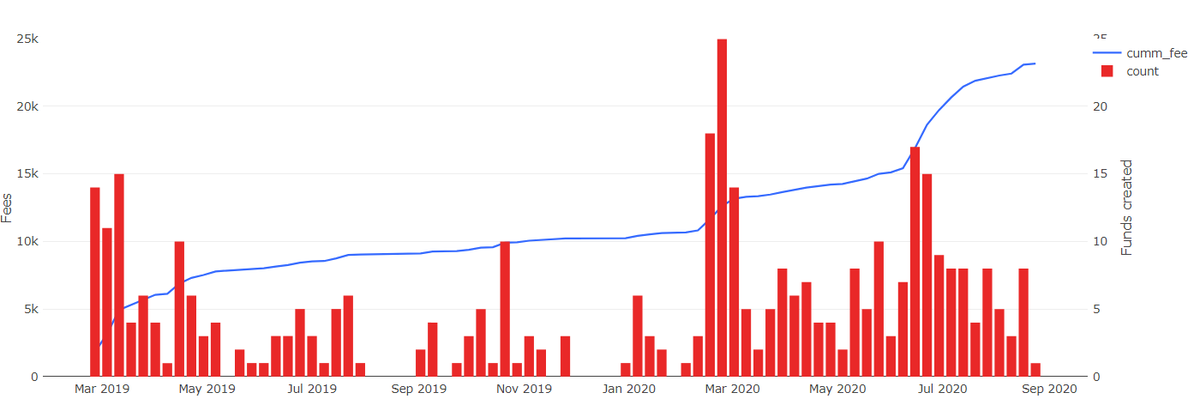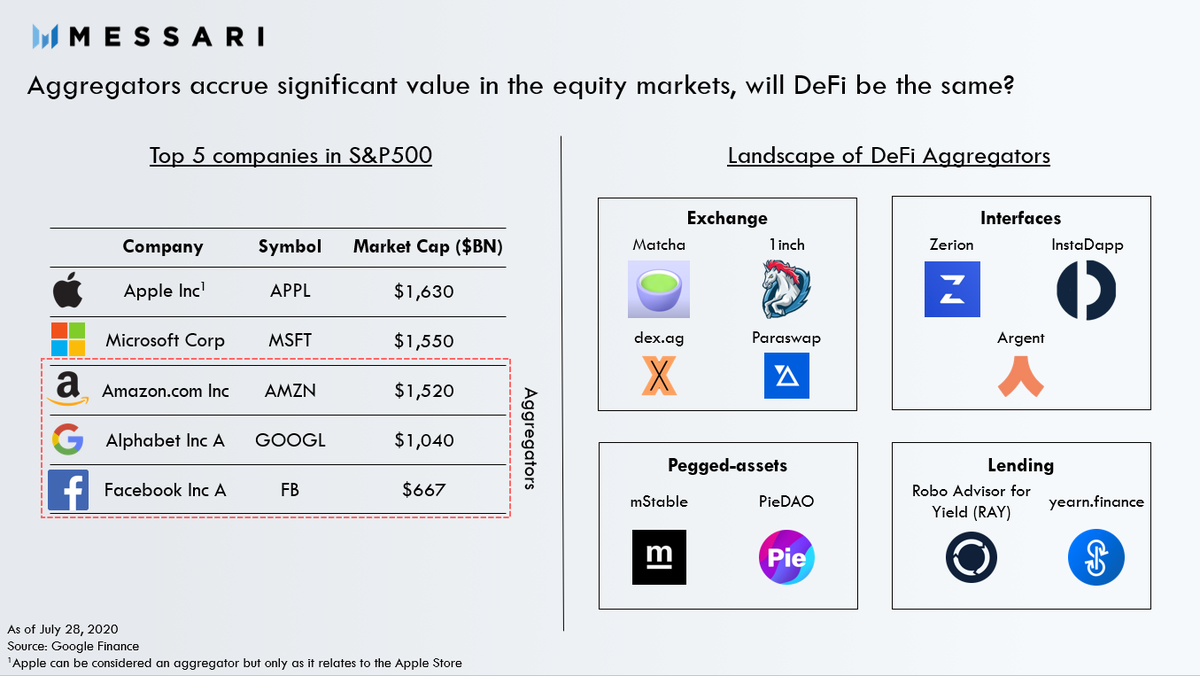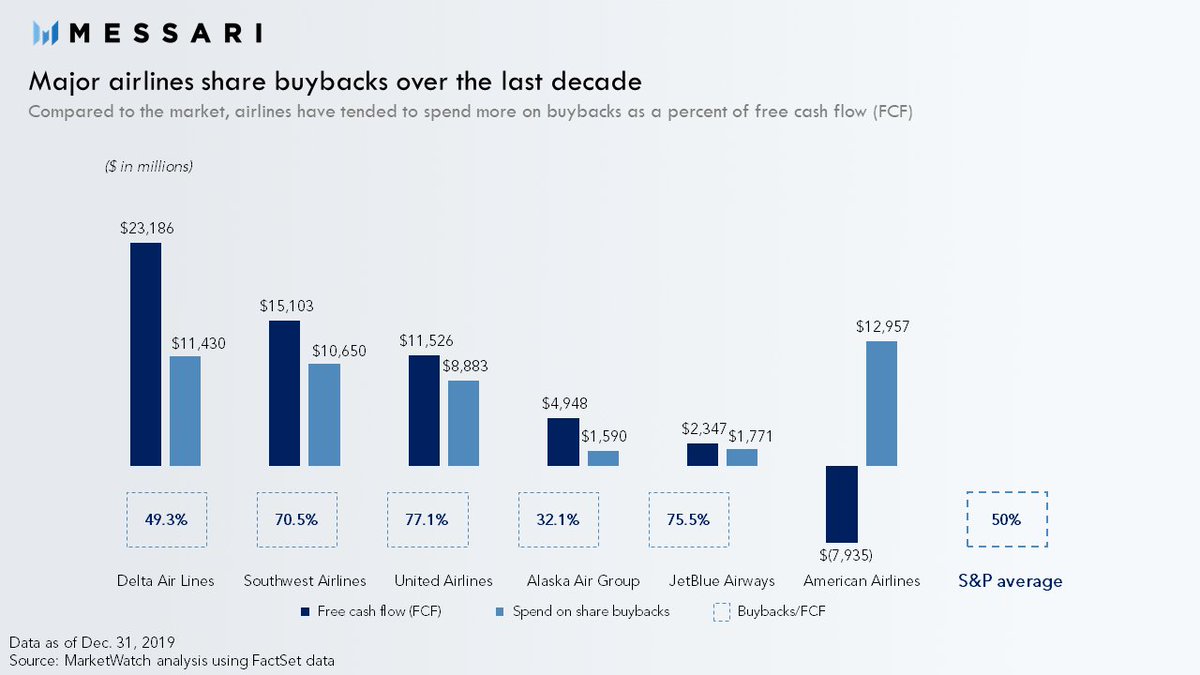
Crypto data analytics is fragmented - there isn't a ubiquitous "Bloomberg Terminal" yet
For anyone looking to do serious research, it can be difficult to find the data you're looking for
So here's a mega-thread on the Crypto Analysts Toolkit 🛠️👇
For anyone looking to do serious research, it can be difficult to find the data you're looking for
So here's a mega-thread on the Crypto Analysts Toolkit 🛠️👇

#1 @DuneAnalytics is my go-to for all DeFi research
They have a number of pre-set dashboards that are vital to keep tabs on the industry
They have a number of pre-set dashboards that are vital to keep tabs on the industry
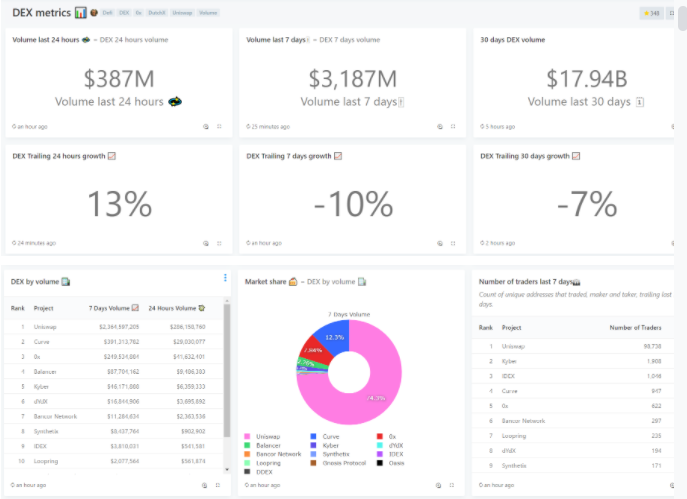
They also have project-specific dashboards for deeper dives
Maker: explore.duneanalytics.com/dashboard/make…
0x: explore.duneanalytics.com/dashboard/0x-t…
Maker: explore.duneanalytics.com/dashboard/make…
0x: explore.duneanalytics.com/dashboard/0x-t…
If you can't find what you're looking for, don't worry you're not restrained to existing dashboards
With a little SQL knowledge (or desire to get some), the possibilities are endless
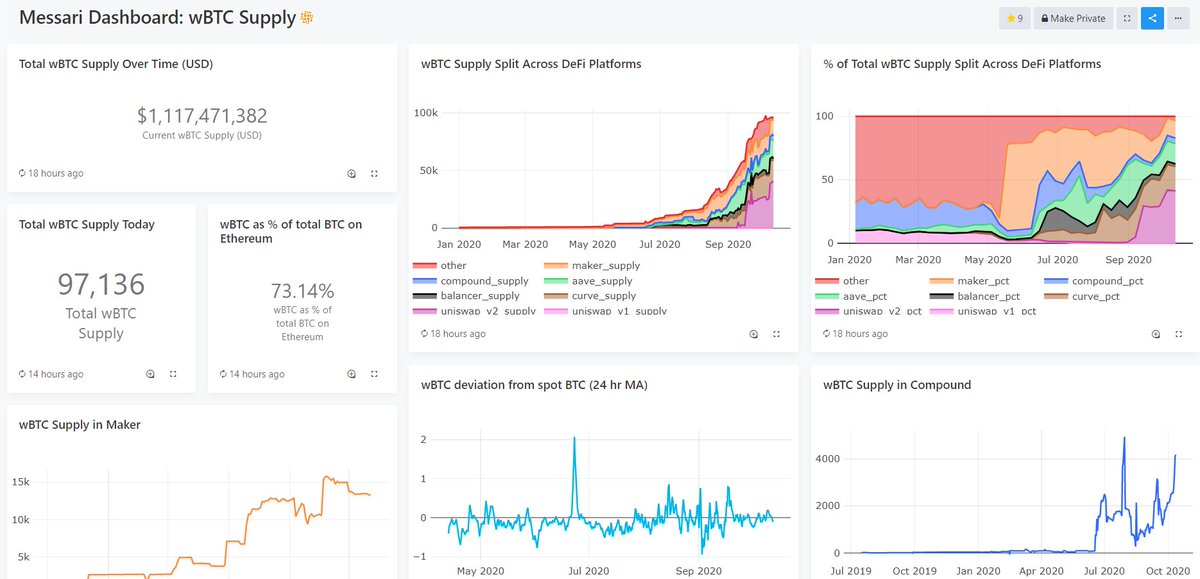
Examples we've created are a dashboard tracking WBTC across DeFi
explore.duneanalytics.com/dashboard/wbtc…
With a little SQL knowledge (or desire to get some), the possibilities are endless
Examples we've created are a dashboard tracking WBTC across DeFi
explore.duneanalytics.com/dashboard/wbtc…
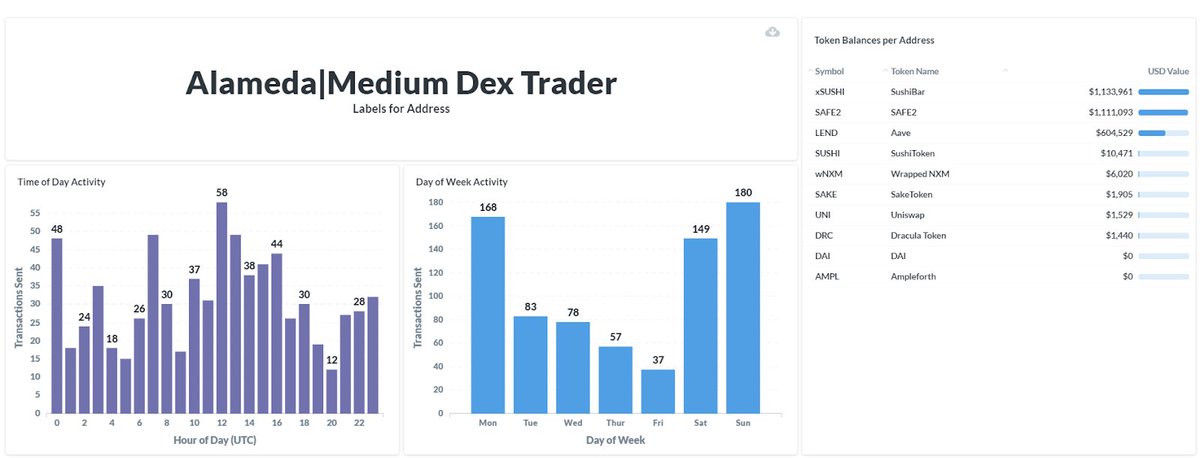
Or even more niche queries like secondary market sales of top #HEGIC token sale buyers
https://twitter.com/jpurd17/status/1310587172408512514?s=20
#2 @nansen_ai is another powerful tool for all DeFi practitioners
Similar to Dune, they provide dashboards on broader sectors as well as specific projects (although less of a selection)
Stablecoin Master
pro.nansen.ai/stablecoin-mas…
Delphi by @akropolisio
pro.nansen.ai/delphi
Similar to Dune, they provide dashboards on broader sectors as well as specific projects (although less of a selection)
Stablecoin Master
pro.nansen.ai/stablecoin-mas…
Delphi by @akropolisio
pro.nansen.ai/delphi
However, Nansen's bread and butter is their versatile tracking tools
Aptly named, the Token God Mode, gives deep analysis into any asset's market behavior
Aptly named, the Token God Mode, gives deep analysis into any asset's market behavior

Another powerful tool is the Wallet Profiler enabling you to peer into the behavior of any wallet address
No longer do you get psyops'd from what people say on twitter since you can get a real-time look into where they put their money
No longer do you get psyops'd from what people say on twitter since you can get a real-time look into where they put their money
#3 @tokenterminal is pioneering many of the tried and true fundamental valuation metrics ported over from the traditional world
While the definition of protocol revenue is often debated, the industry is generally aligning on total fees generated
While the definition of protocol revenue is often debated, the industry is generally aligning on total fees generated
https://twitter.com/kaiynne/status/1285010861141024769?s=20
This provides a starting point to assess the potential earnings could theoretically be captured by token holders in the future 
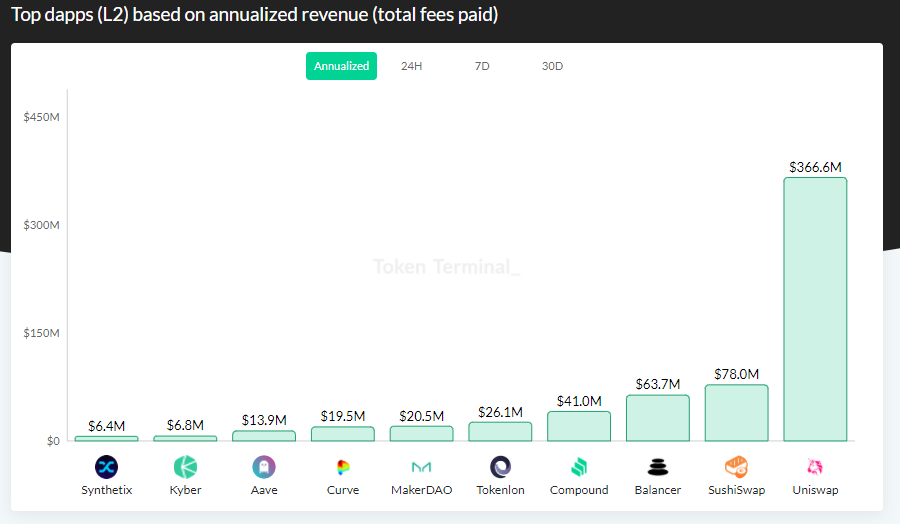
You can then create relative valuation metrics to benchmark this against the market value
We're too early for these to inform investment decisions given the variability/lack of predictability of earnings
But nonetheless can assist in general comparisons
We're too early for these to inform investment decisions given the variability/lack of predictability of earnings
But nonetheless can assist in general comparisons
https://twitter.com/RyanWatkins_/status/1277667147993567237?s=20
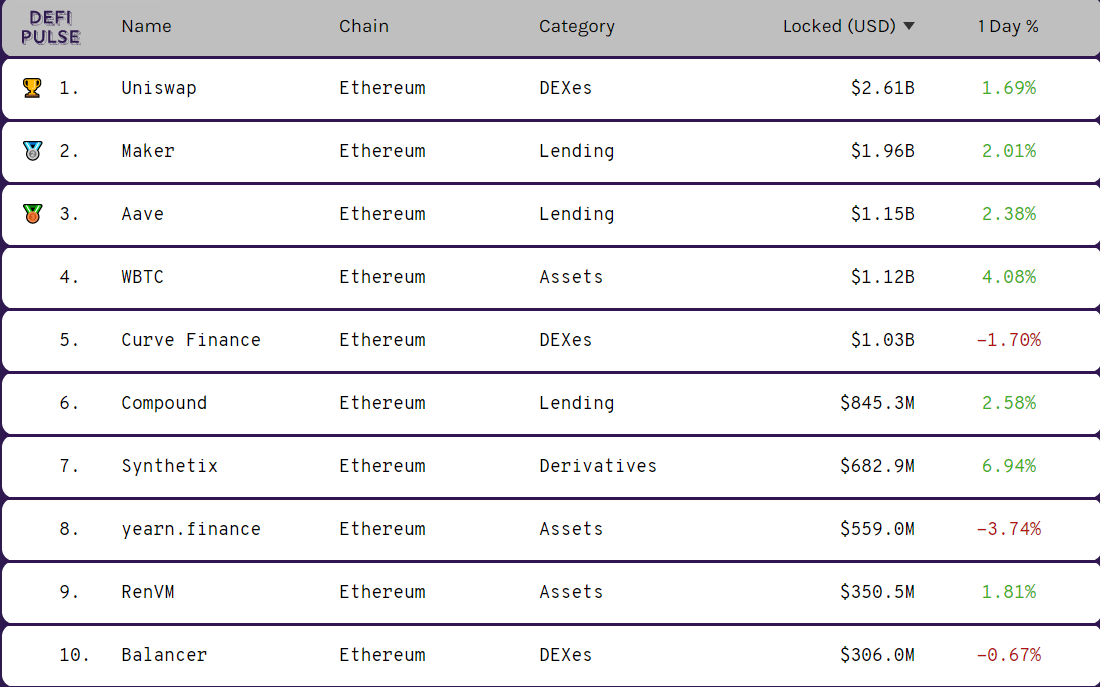
#4 @defipulse TVL metric has become the de facto approximation of the size of DeFi
It can be useful in comparing protocols by demonstrating the belief users put into the security and potential profitability
Also, the sheer size of real economic value ($10b) is astounding 🤯
It can be useful in comparing protocols by demonstrating the belief users put into the security and potential profitability
Also, the sheer size of real economic value ($10b) is astounding 🤯
#5 @etherscan is likely one of the most utilized tools as it facilitates essential functions for users, research, and developers alike
Users typically check it for the state of their pending transaction or to view their entire history
Users typically check it for the state of their pending transaction or to view their entire history
Since you have access to every single Ethereum transaction you can see exactly how complex hacks were pulled off
etherscan.io/tx/0x762881b07…
etherscan.io/tx/0x762881b07…
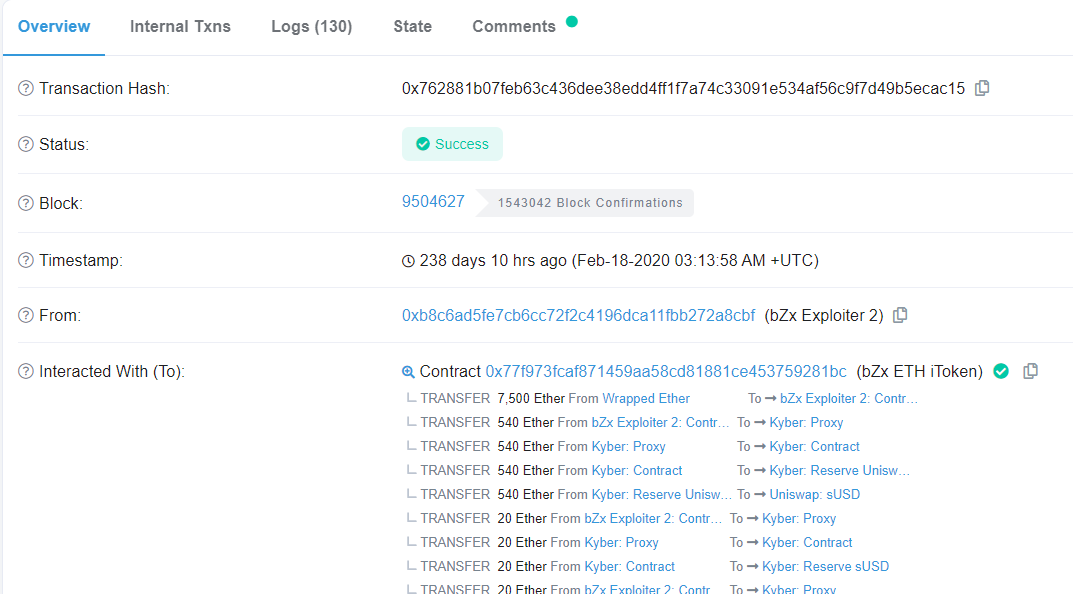
Or highly profitable on-chain arbitrage, available to anyone through flash loans
https://twitter.com/smykjain/status/1288457351201087489?s=20
There are also a number of other tools including various live statistics and charts, gas tracking, mining calculations, and more
But now to step away from DeFi...
But now to step away from DeFi...
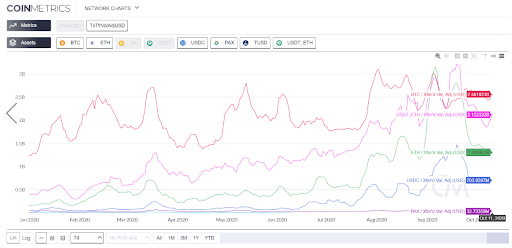
#6 @coinmetrics is one of the best institutional-grade data providers
They cover a broad range of on-chain, price, volume, mining, and supply data points for almost all blockchains
This high-fidelity data is consumable in their easy to use charting for visual comparison
They cover a broad range of on-chain, price, volume, mining, and supply data points for almost all blockchains
This high-fidelity data is consumable in their easy to use charting for visual comparison
#7 @glassnode is another multi-purpose provider with a broad array of charts and dashboards
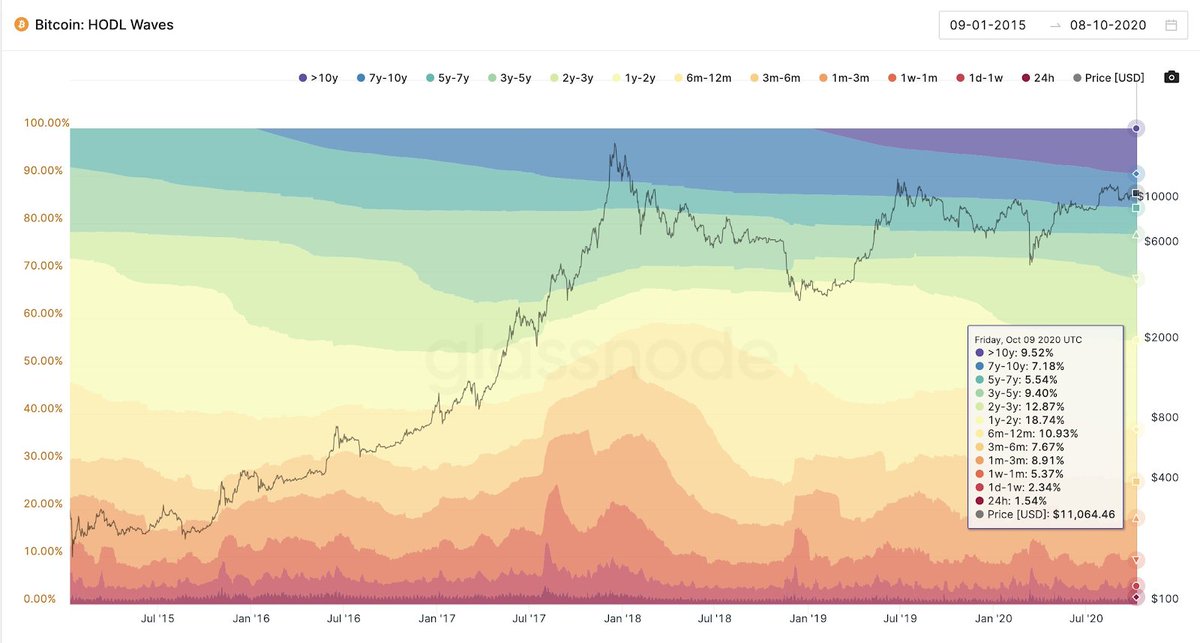
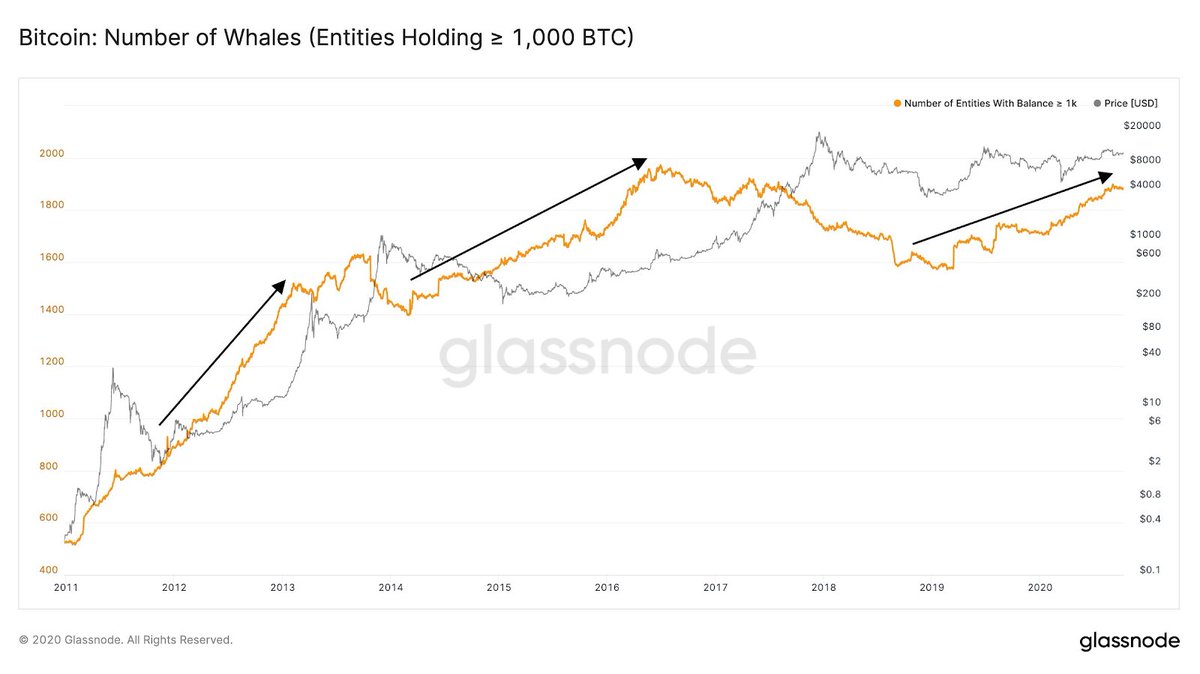
For example, if you were looking into long-term holder behavior you could look at the popular HODL waves chart along with a whale-watching chart showing the # of holders with > 1,000 BTC

For example, if you were looking into long-term holder behavior you could look at the popular HODL waves chart along with a whale-watching chart showing the # of holders with > 1,000 BTC
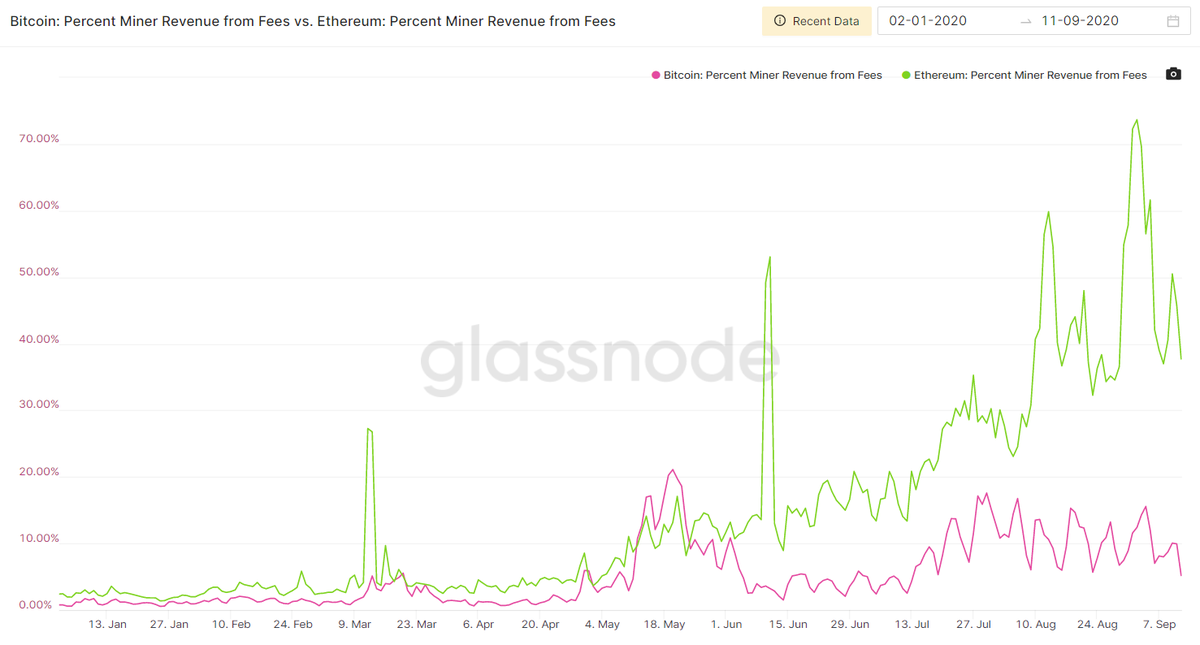
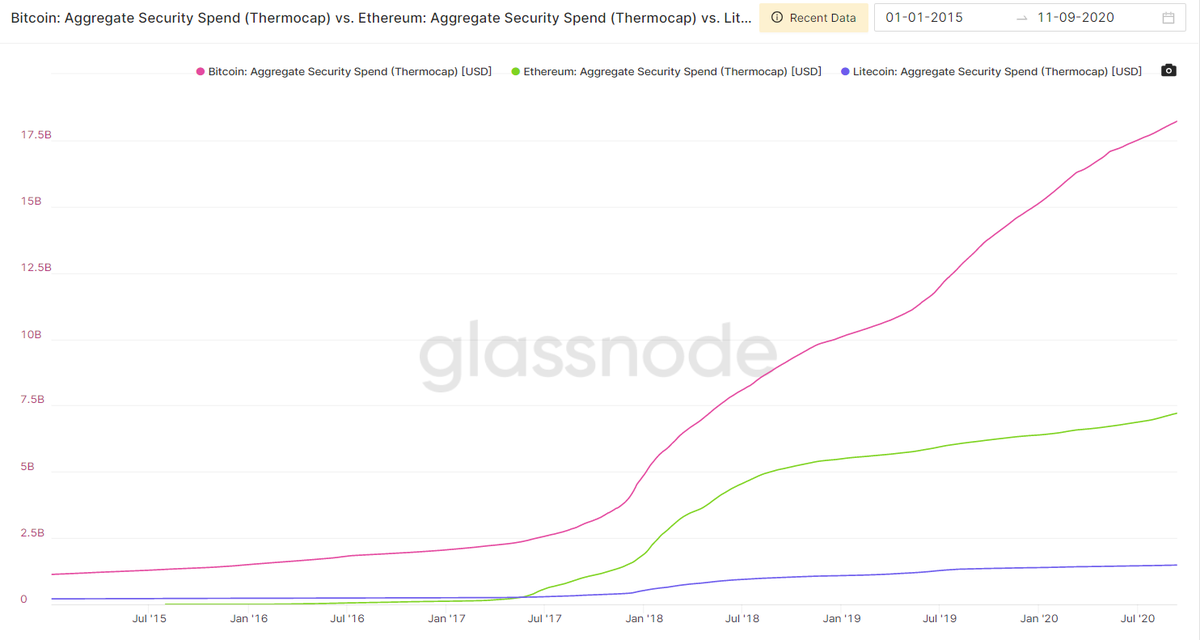
Alternatively, you could also compare blockchains on important but often overlooked metrics
Such as the % of miner revenue from fees, or aggregate security spend

Such as the % of miner revenue from fees, or aggregate security spend
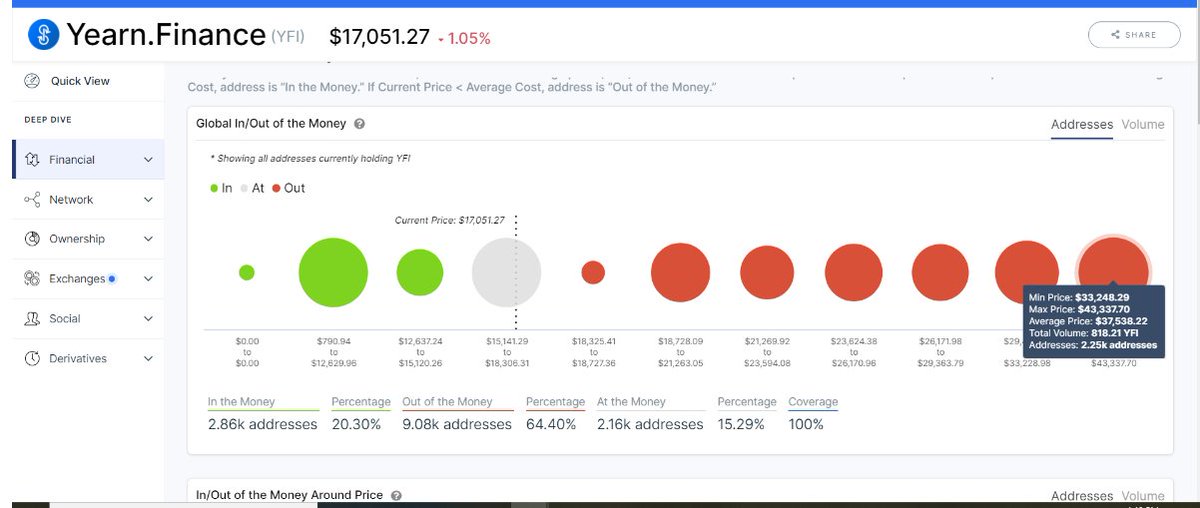
#8 @intotheblock is one last onchain/market analytics provider with a number of interesting tools to supplement one's diligence
The Into/Out of the Money chart is helpful in assessing the global profitability of token holders which can inform future buying and selling behavior
The Into/Out of the Money chart is helpful in assessing the global profitability of token holders which can inform future buying and selling behavior
#9 @skewdotcom Analytics does one thing and one thing well - derivatives
They are the go-to for all btc/eth futures, options data
This can be particularly helpful in analyzing crypto market structure during stress tests like Black Thursday
They are the go-to for all btc/eth futures, options data
This can be particularly helpful in analyzing crypto market structure during stress tests like Black Thursday
https://twitter.com/jpurd17/status/1242827035388633088?s=20
#10 Last but not least (and you could have seen its one coming)... @MessariCrypto
Not just because I'm writing this as an employee, but I'd be lying if I said I didn't use it on a regular basis
Not just because I'm writing this as an employee, but I'd be lying if I said I didn't use it on a regular basis
The core screener allows to keep up with short/long term price movements
messari.io/screener/defi-…
messari.io/screener/defi-…
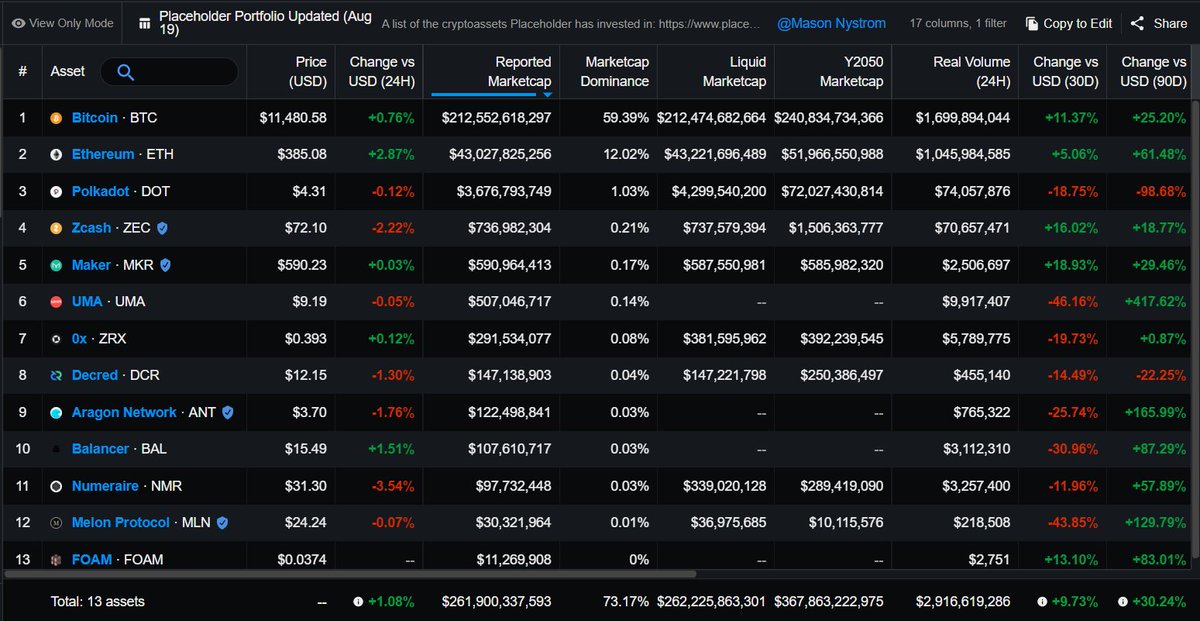
We've also compiled a list of a number of the top crypto funds portfolios so you track where the smart money
is going
messari.io/article/invest…
is going
messari.io/article/invest…
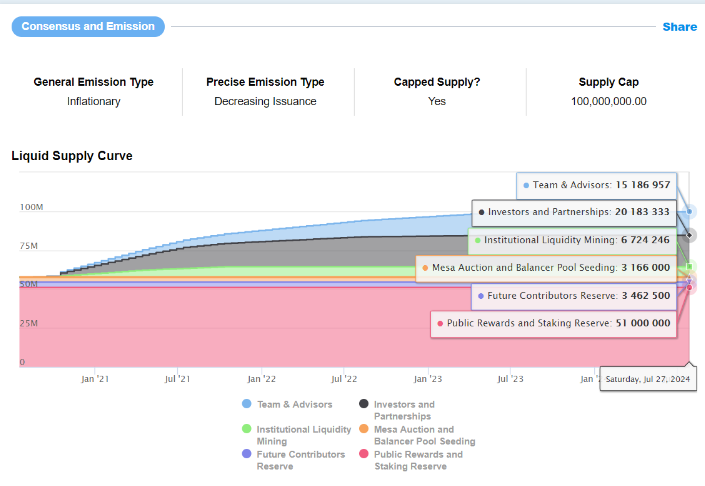
Lastly, one of my personal favorites - the liquid supply curve tracks one of the least understood, yet important, metrics for a crypto investor
Knowing precise lock-ups is imperative to know when/if the market could be flooded with sell pressure
Knowing precise lock-ups is imperative to know when/if the market could be flooded with sell pressure
That's it for now, this list is far from exhaustive as it's near impossible to include every provider
But as this space continues to grow, the data/analytics tools will only mature with it, continuing to meet the needs of every crypto professional
messari.io/article/the-ul…
But as this space continues to grow, the data/analytics tools will only mature with it, continuing to meet the needs of every crypto professional
messari.io/article/the-ul…
• • •
Missing some Tweet in this thread? You can try to
force a refresh
