
As promised last week, here is a thread to explore and explain some beliefs about interim analyses and efficacy stopping in randomized controlled trials.
Brief explanation of motivation for this thread: many people learn (correctly) that randomized trials which stop early *for efficacy reasons* will tend to overestimate the magnitude of a treatment effect.
This sometimes gets mistakenly extended to believing that trials which stopped early for efficacy are more likely to be “false-positive” results, e.g. treatments that don’t actually work but just got lucky at an early interim analysis.
That’s not quite true, but I see why people (mistakenly) make the leap from “trials that stop early (for efficacy*) overestimate the true treatment effect” to thinking “trials that stop early are more likely to be false positive results” even though it’s not quite right.
*note: this is confusing because some people mistakenly read this as “all trials that stop early will overestimate the treatment effect” which is not quite correct. The statement is only true of trials that are stopped early *for efficacy* when viewed in aggregate.
At any given randomly-selected point for a *single* trial, the treatment effect is unbiased; so if all trials were stopped early at *random* times (not based on the data) there is no bias, but trials that are stopped early *for efficacy* is conditional on the observed data.
Hold that thought, I’ll revisit this later in the thread.
Via some simple simulations, I’ll do my best to work through a few of these things, while freely admitting a) I’m not the world’s leading expert on this and b) encouraging people to expand on select points if they’re better at this than I am.
For today’s thread, I will be discussing trials designed & executed in the traditional frequentist paradigm. I have plans to try to replicate this thread with a Bayesian approach at some point, but I’ve already dallied long enough for the people who asked for this.
Plus, the examples which motivated this explainer (for clinical readers) are traditional frequentist trials, and this is meant to help them understand. You want to talk about Bayes, feel free to do your own version of this thread until I get around to it.
I will use a straightforward example for many of the simulations that follow.
Consider a parallel-group 1:1 randomized trial with a binary outcome variable.
Consider a parallel-group 1:1 randomized trial with a binary outcome variable.
Suppose that the true probability of failure (e.g. “in hospital mortality”) is 40% in patients receiving the usual care / control intervention.
Suppose that the experimental intervention is, in fact, effective: it reduces the risk of in hospital mortality to 30% (so the “true” treatment effect is a 10% absolute risk reduction / 25% relative risk reduction / odds ratio=0.65 depending on your metric of choice).
The trial will be designed to enroll N=1000 patients overall (500 per treatment arm).
Throughout this thread, I will show you a series of plots of the odds ratio (my chosen measure of treatment effect) as it would be computed every 100 patients (for now, I will *just* be showing the point estimate(s) of the odds ratio on this plot).
Here is one hypothetical trial. 
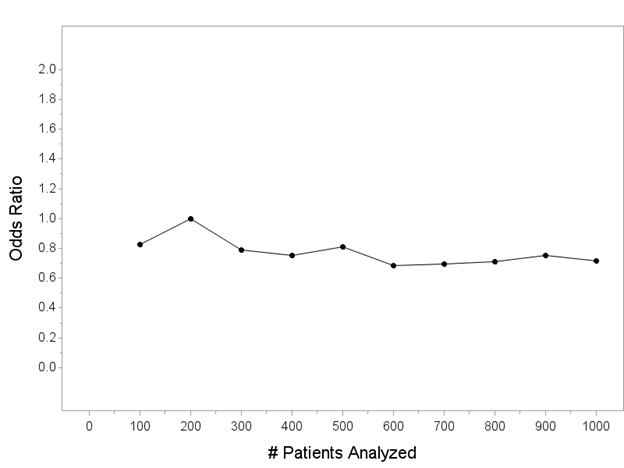
y-axis is the point estimate of the OR (computed every 100 patients; this is not “the interim analysis” that would be done for the trial, I’m letting you peek behind the curtain as though we are continuously looking). x-axis is the number of patients included in each analysis.
For reference, let’s add a horizontal line at OR=0.65, which is about the “true” effect size for an intervention that changes outcomes from 40% mortality in control patients to 30% for patients that receive the intervention.
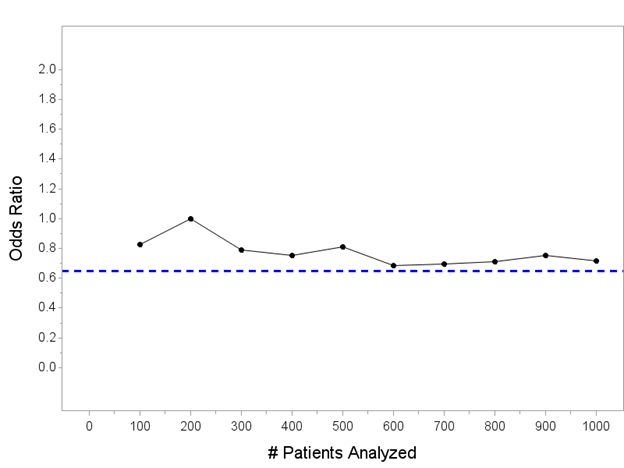
Keep in mind: the horizontal blue line is the *actual* treatment effect in *all* of the simulated trials we do in this thread.
Simulated trials that end up with point estimates above the line have *underestimated* the true treatment effect; simulated trials that end up with point estimates below the line have *overestimated* the true treatment effect.
In general, we expect the point estimate(s) to converge on the blue line with more patients. If we could enroll an infinite number of patients with these characteristics, the point estimate would be 0.65.
Since we can’t enroll an infinite number of patients, we’re stuck with one observed set of N=1000 patients. So…
Here are 100 hypothetical trials that could unfold with my one intervention that reduces mortality from 40% to 30% (but remember, we don’t know that yet!) being tested in a trial of N=1000 patients, showing you the estimated OR computed every 100 patients until enrolling N=1000
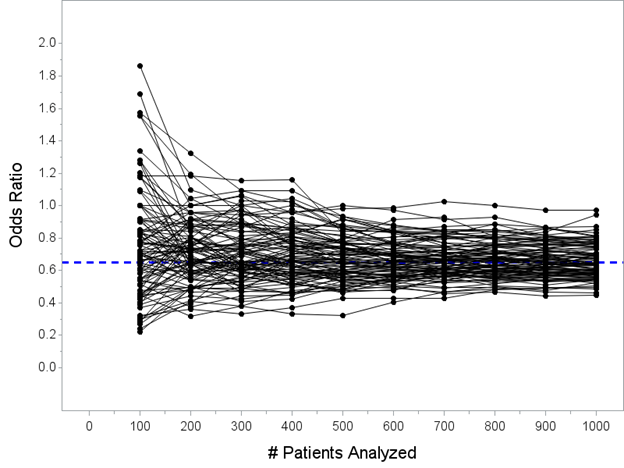
Note that we haven’t actually touched the formal interim analyses and efficacy stopping rules yet. I’m just trying to show you some hypothetical paths that can unfold for an intervention that actually reduces hospital mortality from 40% to 30% as it enrolls N=1000 patients.
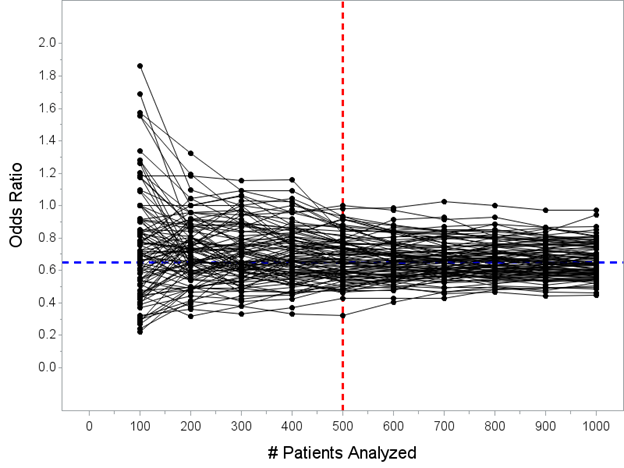
So now, let’s talk about the interim analysis issue. I’m going to keep this simple. There will be one formal interim analysis that allows efficacy stopping at N=500 patients.
Here's all 100 trials again. Remember, the blue line is the *actual* treatment effect, and that’s actually the *truth* for all of the trials pictured here. Now I’ve added a vertical red line at N=500 patients for you, when the interim analysis would take place.

Pay close attention here! This is key to understanding one of the mistaken-interpretation points here, which is that some people incorrectly think *all trials* overestimate the true effect if stopped early.
The median OR at N=500 pts in 100 simulated trials is OR=0.66, right around the true value of 0.65. Any trial stopped *at random* does not have a bias. It is only when we limit to trials stopped early *for efficacy* that there is a bias, which we’ll go look at now…
It’s only when we consider only “trials that stop early for efficacy” that there is a bias. Let’s explore why. Look at the picture again. Care to guess which of these trials would stop at my N=500 look for efficacy?
Now I’ve highlighted the trials that would stop at the N=500 analysis in red. Hopefully this doesn’t surprise anybody that these are the trials that stopped early. 29 of the 100 simulated trials stopped early for efficacy at my N=500 interim analysis.
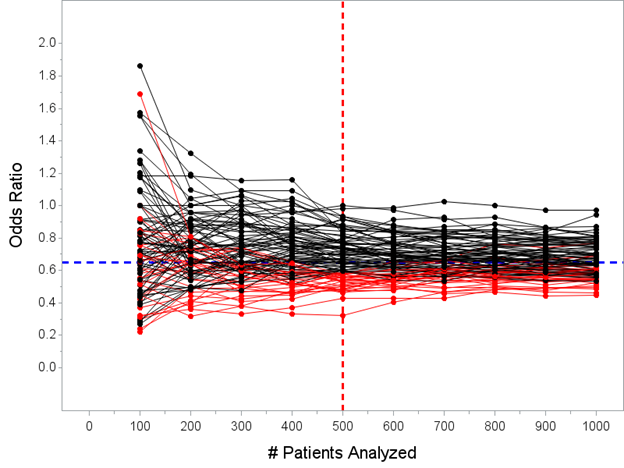
As you hopefully understand, the only trials that actually stop early for efficacy are the ones where the data is overwhelmingly in favor of benefit at the N=500 interim analysis, so much we would not continue because the outcome is unlikely to reverse by the final analysis.
(also remember that the red lines on that Figure actually wouldn’t continue past N=500, the trials would actually stop, I’ve just simulated N=1000 patients for all of the trials…here’s maybe a better picture of what would actually happen)
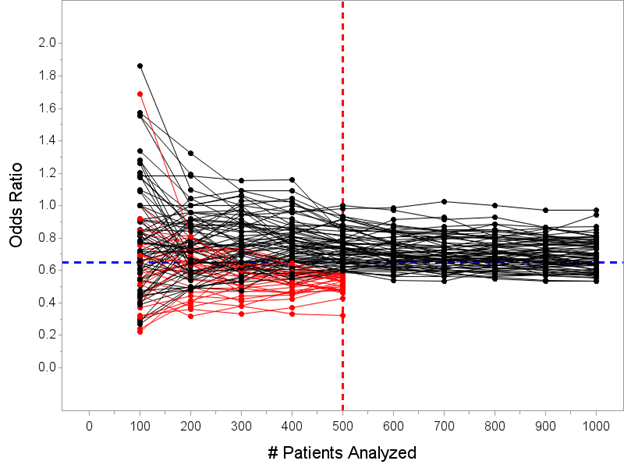
The median estimated OR for the 29 trials that stopped early for success is 0.53 with a range 0.32 to 0.59. Remember, the *true* effect is OR=0.65, so “the point estimate from trials stopped early for efficacy will tend to overestimate the true effect” is an accurate statement.
But this does not = “the observed benefit is more likely to be a false positive or the play of chance.” The treatment there works! And, the upper limit of the 95% CI for the “weakest” trial that stopped early was 0.86 at the N=500 look.
I don’t want to get into the whole “confidence intervals versus Bayesian credible intervals” thing here, but the data here have to strongly support a benefit to be allowed to stop early.
It’s not necessarily true to say that the intervention in my trial which stopped early with OR=0.59, 95% CI 0.41-0.86, p=0.0054 after N=500 is “less likely to have a true benefit” than a trial that has gone to the final analysis.
(It is true that if the point estimate remained exactly the same, the confidence interval would tighten and you might be “more confident” that the point estimate was closer to the true effect, but that’s not the same thing)
This is where a Bayesian (looking at you @KertViele) could go on a useful tangent: perhaps show the posterior prob of benefit at an N=500 interim that would stop in the scenario I’ve laid out & compare that against final prob of benefit for trials that continue to N=1000.
Another spin on this that I can give, though, from the frequentist perspective, is to simulate trials where there is NO benefit and show that the % which stop early for efficacy is low.
(In fact, there’s an even more obvious check on this, which is the alpha spending function used and threshold to stop at the interim, but simulations tend to be more effective in getting this across)
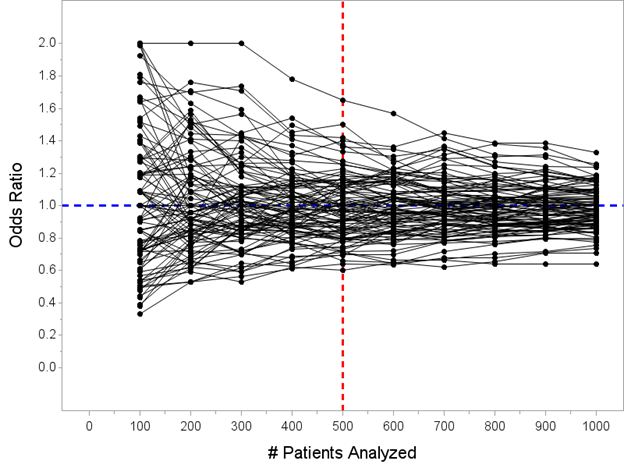
Now I’ve moved the horizontal line from OR=0.65 to OR=1.00 (since there is no tx effect). Here are another 100 simulated trials. Only one of these 100 trials would have crossed the threshold required (p<0.0054 at N=500) to declare efficacy at the planned interim analysis.
Now I must admit that this isn’t quite answering the same probability question as “what is the probability that the drug is effective given that the trial stopped early versus probability the drug is effective if the trial went to completion.”
I’m hoping a sharp Bayesian can branch off this thread to explore some calculations of “probability that tx is effective” for a selection of studies that would stop early for efficacy versus studies that proceed to completion using the same basic parameters I laid out here.
But I have seen @KertViele point out previously that (usually) this ends up being *higher* for trials that stop early due to efficacy than trials that proceed to completion because the thresholds to stop are very high (most trials are pretty conservative with early looks).
Summary: i) yes, trials that stop early for efficacy will tend to overestimate the treatment effect (in the sense that the point estimate will tend to be higher than the true treatment effect);
Summary: ii) this does not mean that the intervention is less likely to work in a trial that stopped early for efficacy than a trial that proceeded to completion;
Summary: iii) it is true that we will always get a “more precise” estimate of the treatment effect with bigger trials, but this is necessarily counterbalanced with ethical considerations of continuing to randomize if there is sufficient evidence that intervention works;
Summary: iv) the degree of “overestimation” is (usually) going to be relatively modest, though of course this depends a lot on specifics of when interims occur, how many patients, type of outcome, etc.
(It is true that there are more scholarly references on this subject, many of them, for those so inclined; this is mostly intended as an illustration/explainer for many MD's who read trials and wonder about this thing they've heard...
...where they read that trials which stop early tend to over-estimate the true treatment effect, and how that should affect the way they read and interpret trials that stopped early for efficacy)
So I can think of a couple "Bayesian tangents" that we could go on from this thread & decided to give one a shot. A bigger one would be to discuss how this would unfold in a "fully Bayesian" trial. That will take a bit longer...
But what I *can* do is take the example I laid out here and compute the Bayesian posterior probability of a positive treatment effect (OR<1) for the "weakest" possible trial that stopped early and compare that to...
...the Bayesian posterior probability of a positive treatment effect in the "weakest" possible positive finding at the final analysis.
I'm kinda violating a maxim here, which is "never ask a question that you don't already know the answer to" but I'm curious so here goes...
I'm kinda violating a maxim here, which is "never ask a question that you don't already know the answer to" but I'm curious so here goes...
One of my simulations stopped at the interim analysis with an OR=0.59, 95% CI 0.41-0.85, p=0.0051. That's about the weakest possible result I can have that would have met the early stopping threshold.
A Bayesian analysis of that same data with a Normal(0,1) prior on the treatment effect returns a posterior mean OR=0.61 with a 95% CrI 0.41-0.85 and posterior prob(OR<1) = 0.998 (translation: 99.8% probability of positive treatment effect)
Remember, that's just about the *weakest* possible result that could have stopped early in the trial design that I had laid out. Now let's compare that to the posterior prob of a positive treatment effect in a trial that continued past the interim but concluded success at final.
I've got another one that would have continued past the interim at N=500 and concluded success at the final analysis: OR=0.77, 95% CI 0.59-0.99, p=0.0419 at N=1000.
This would be success at the final, but it's one of the weakest possible results that skates in as a positive trial. What's the Bayesian posterior probability of a positive treatment effect? Drumroll...
Sorry, it was a very long drumroll, got pulled away for a moment.
The posterior mean OR=0.78, 95% CrI 0.60-1.00, posterior prob OR<1 is 97.5%
The posterior mean OR=0.78, 95% CrI 0.60-1.00, posterior prob OR<1 is 97.5%
So (IN THIS EXAMPLE) the posterior probability of a treatment effect (OR<1) in the *weakest possible trial that would stop early for benefit at the N=500 interim* is still higher than the posterior probability of treatment effect that would be required to "win" at final analysis
This, I think, is a really important point to understand in teasing apart the "probability that there is a benefit" for trials that are stopped early versus trials that proceed to completion.
Generally, the threshold for early stopping is sufficiently high that the evidence supporting a treatment benefit for trials that end up stopping is actually higher than would be required to "win" at the final analysis.
• • •
Missing some Tweet in this thread? You can try to
force a refresh


