It's #WorldFoodDay
Much of our work at @OurWorldInData covers food & agriculture – it's central to many of the world's largest problems
Feeding everyone a nutritious diet in a sustainable way is one of our biggest challenges this century
Thread of some of our work on this 👇
Much of our work at @OurWorldInData covers food & agriculture – it's central to many of the world's largest problems
Feeding everyone a nutritious diet in a sustainable way is one of our biggest challenges this century
Thread of some of our work on this 👇
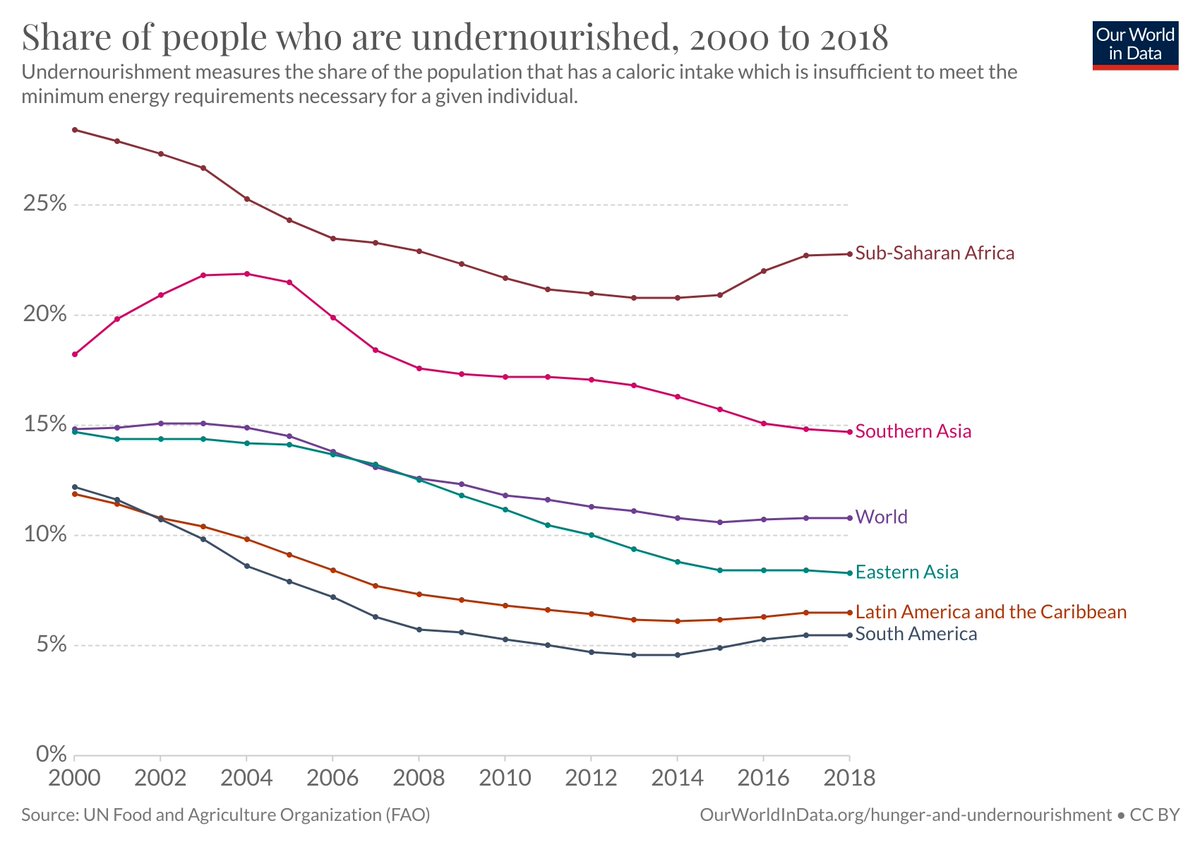
No one in the world should go hungry.
Global hunger has declined massively over the long-term, but more than 1-in-10 (> 820M people) are undernourished.
This is unacceptable in a world where we produce more than enough for everyone.
Our work on hunger:
ourworldindata.org/hunger-and-und…
Global hunger has declined massively over the long-term, but more than 1-in-10 (> 820M people) are undernourished.
This is unacceptable in a world where we produce more than enough for everyone.
Our work on hunger:
ourworldindata.org/hunger-and-und…
Despite rapid population growth over the last century, famines have become much more rare.
Today they are largely the result of sociopolitical instability, war and inequality vs. a lack of food on aggregate.
@JoeHasell and @MaxCRoser's work on Famines: ourworldindata.org/famines
Today they are largely the result of sociopolitical instability, war and inequality vs. a lack of food on aggregate.
@JoeHasell and @MaxCRoser's work on Famines: ourworldindata.org/famines

Improvements in yields & increased food production mean food supply *per person* across the world has risen significantly over the last 50 years.
This is despite an increasing population.
Our work on food supply: ourworldindata.org/food-supply
This is despite an increasing population.
Our work on food supply: ourworldindata.org/food-supply

But it's not just food quantity that matters. It's also the quality.
For good health we need varied diets. Poorer countries tend to have a diet lacking variety and dominated by cereals. Diets diversify as we get richer.
Our work on Diet Compositions: ourworldindata.org/diet-compositi…
For good health we need varied diets. Poorer countries tend to have a diet lacking variety and dominated by cereals. Diets diversify as we get richer.
Our work on Diet Compositions: ourworldindata.org/diet-compositi…

Poor dietary diversity and lack of micronutrients can have severe health implications.
WHO estimates as many as 2 billion people suffer from hidden hunger.
Particularly detrimental for children and pregnant women.
Our work on micronutrient deficiency: ourworldindata.org/micronutrient-…
WHO estimates as many as 2 billion people suffer from hidden hunger.
Particularly detrimental for children and pregnant women.
Our work on micronutrient deficiency: ourworldindata.org/micronutrient-…

As we get richer we tend to eat more meat.
Global meat consumption has increased 5-fold since 1960.
Meat & dairy is a key nutrition and income source for many. But it also comes with high environmental impacts.
Our work on Meat & Dairy Production: ourworldindata.org/meat-production
Global meat consumption has increased 5-fold since 1960.
Meat & dairy is a key nutrition and income source for many. But it also comes with high environmental impacts.
Our work on Meat & Dairy Production: ourworldindata.org/meat-production

Food is really the mother of sustainability issues.
→ Quarter of GHG emissions
→ 50% habitable land use
→ 70% freshwater
→ Largest driver of biodiversity loss
Our work on the Env impacts of food: ourworldindata.org/environmental-…
→ Quarter of GHG emissions
→ 50% habitable land use
→ 70% freshwater
→ Largest driver of biodiversity loss
Our work on the Env impacts of food: ourworldindata.org/environmental-…

Half of global habitable land is used for agriculture.
To reduce this we can:
1. Produce and eat less meat and dairy
2. Switch to more land-efficient animal products
3. Increase crop yields
Our work on land use: ourworldindata.org/land-use
To reduce this we can:
1. Produce and eat less meat and dairy
2. Switch to more land-efficient animal products
3. Increase crop yields
Our work on land use: ourworldindata.org/land-use

Agriculture would take up much more land if we hadn't seen massive increases in yields across the world.
For me, increased yields has been one of our finest achievements.
Our work on Crop Yields: ourworldindata.org/crop-yields
For me, increased yields has been one of our finest achievements.
Our work on Crop Yields: ourworldindata.org/crop-yields

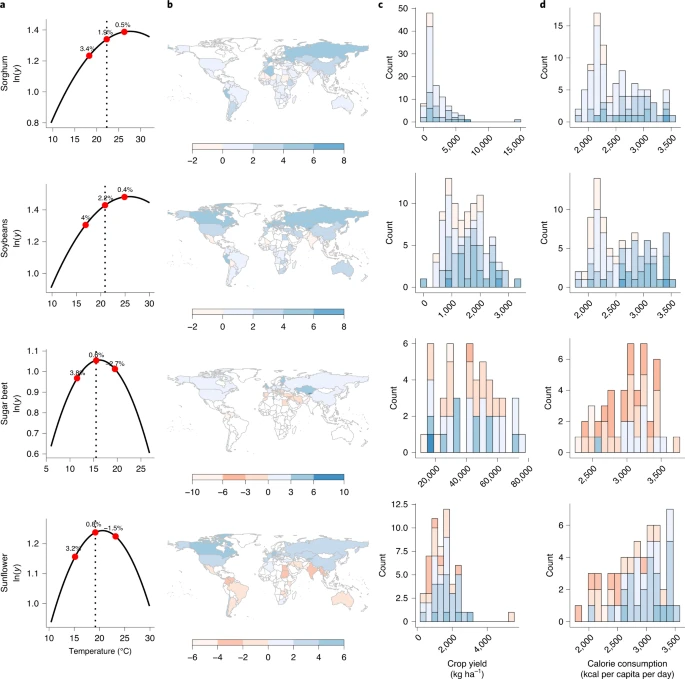
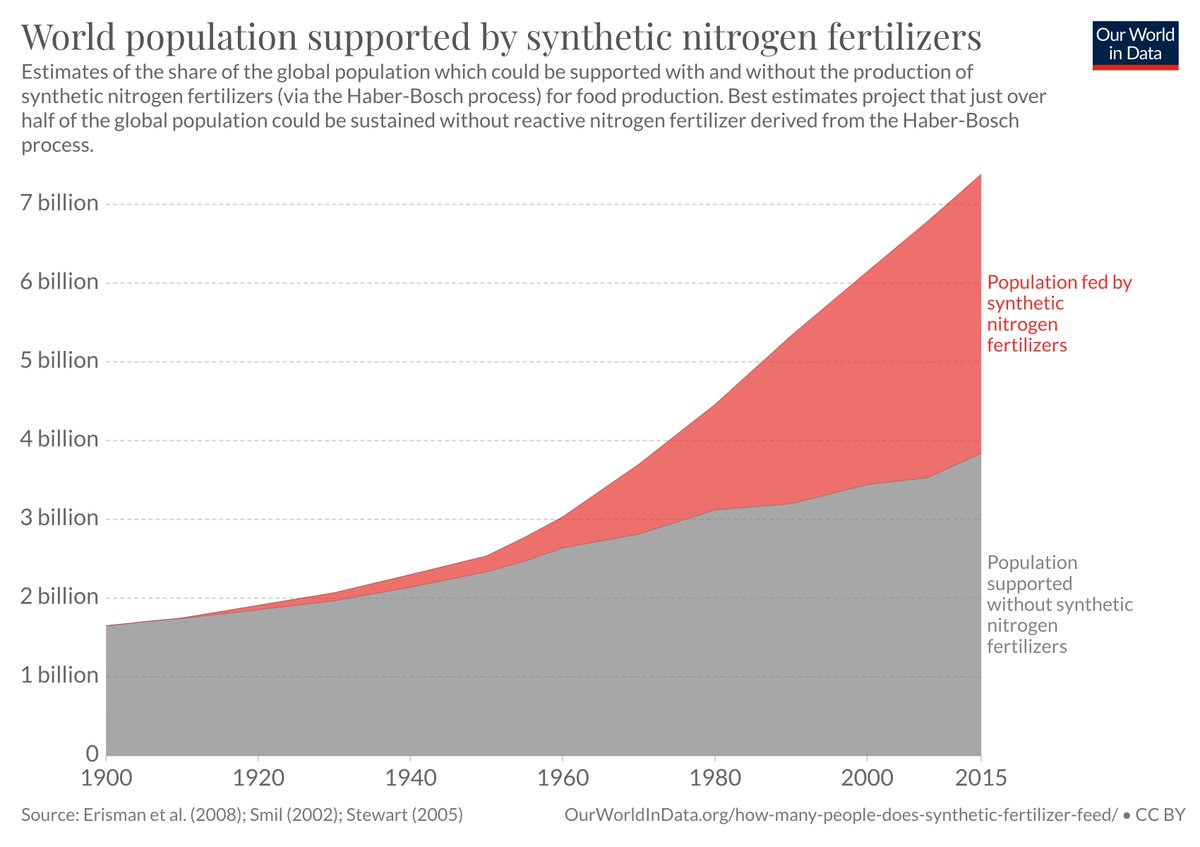
Improved seed varieties, irrigation and various agricultural innovations led to this increase in crop yields.
But synthetic fertilisers have been absolutely key. It's estimated that half of the world population rely on them.
Our work on Fertilizers: ourworldindata.org/fertilizers
But synthetic fertilisers have been absolutely key. It's estimated that half of the world population rely on them.
Our work on Fertilizers: ourworldindata.org/fertilizers
Our challenge in the coming years is to find combined solutions to these challenges: nutritious diets for everyone in the world whilst restoring the environment at the same time
...
...
...
@OurWorldInData will try to continue pulling together the best data & research on this to do our bit to get us there.
Many great minds across the world are working on these problems, and of course without them we would not be able to so. Thank you!
@OurWorldInData will try to continue pulling together the best data & research on this to do our bit to get us there.
Many great minds across the world are working on these problems, and of course without them we would not be able to so. Thank you!
• • •
Missing some Tweet in this thread? You can try to
force a refresh