
Our article on deep & extreme poverty is now available @Demography (w/ @ZParolin). We provide estimates of the levels & trends in both deep and extreme poverty 1993-2016. IMO, we substantially advance beyond past research on this topic. link.springer.com/article/10.100…
Our most important finding is that there are disturbingly high levels of deep & extreme poverty in the US. In 2016, we estimate that 5.2 to 7.2 million Americans (1.6% to 2.2%) were deeply poor and 2.6 to 3.7 million (0.8% to 1.2%) were extremely poor.
Throughout, we demonstrate the crucial role of careful measurement. It is essential to follow leading international standards in income & poverty measurement, to correct data for survey underreporting, and especially to include ALL transfers & taxes.
We show deep & extreme poverty have increased since 1990s: Deep poverty increased increased 48%-93%, and extreme poverty increased 54-111%. Both levels & trends depend on how one measures deep & extreme poverty – we demonstrate it is essential to show multiple estimates for each.
The extreme poverty lit has become unfortunately polarized in recent years. Edin & Shaefer say 4% of HHs are <$2/day. Meyer & Sullivan et al say there is almost zero $2/day poverty. We are in between and argue strongly for more careful and transparent measurement.
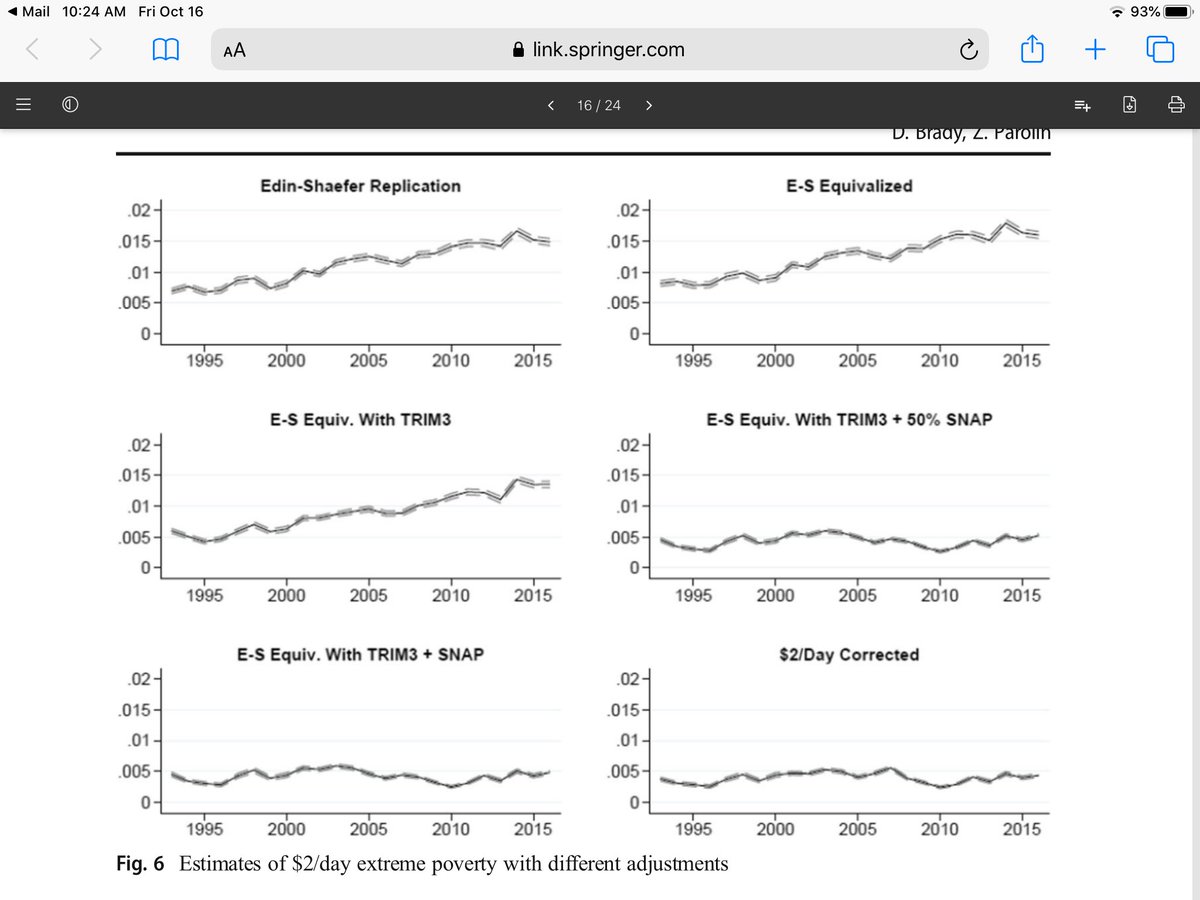
Our estimates suggest Edin & Shaefer’s estimates are far too high, and we demonstrate how our estimates are more credible. Our replication puts $2/day at 1.6% or 5.2 million. After our corrections, we 0.44% or 1.4 million are <$2/day. Most important, we include SNAP.
This figure shows how the estimates change as you move from E&S’s approach to what we argue is a more defensible measurement strategy. 
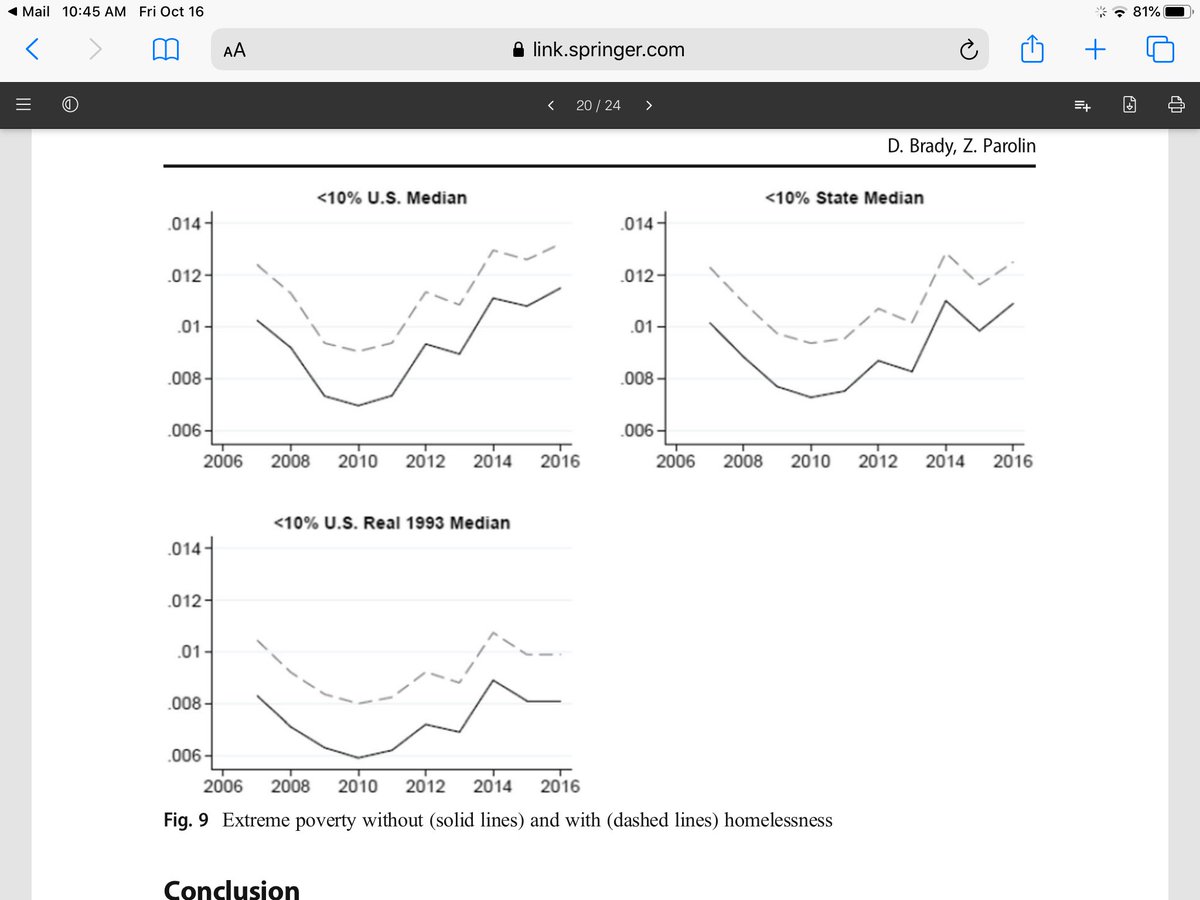
However, we also disagree with Meyer, Sullivan, et al who say there is ~zero extreme poverty. We argue for a much higher & more credible threshold at 10% of medians, and show a significant increase when agreeing with adding SNAP, all taxes & transfers, & survey underreporting.
The journal gave Reviewer 2 (i.e. Sullivan) a chance to write a comment even though other reviewers disagreed with him. In review process, Sullivan even argued that the homeless might not be extremely poor. We disagree.
Sullivan’s comment weirdly argue survey corrections result in an underestimate of extreme poverty (so therefore we’re wrong), BUT, we still somehow overestimate extreme poverty (?). See reply here: link.springer.com/article/10.100…
We also show that addressing Sullivan’s concern with underreported earnings does not change our story. We *embrace* showing estimates with this correction too. Sullivan sidesteps (ignores?) that we had already done so in review process & appendices.
Re Sullivan’s critique: figure shows estimates w/ & w/o imputed earnings. You cannot even see the difference as the lines are almost identical (there are TWO lines within what looks like just 1 line). Even dropping any zero earners doesn’t really change story.

To get a sense of how the lit has gone astray by omitting SNAP, this figure shows the extreme poor are actually far more like to be in childless households not children. And policy around SNAP not welfare reform & TANF is what us driving the variation.

The Meyer et al crew has made a lot of valuable contributions. Indeed, we were greatly influenced by their work on household surveys. But I worry they’ve gone too far in claiming there is no extreme poverty in US.
For one, they say there is less extreme poverty than even the National Point in Time homeless count (which everyone agrees is an underestimate itself). This lacks face validity. By contrast, we show omitting homeless means our estimates are lower bounds.
Meanwhile, Sullivan ignores that we can get an estimate extremely close to Meyer et al using only our methods. One doesn’t need admin data or to make some of Meyer et al’s strange choices, and one can still get an estimate of very low $2/day in 2011. Our approach gets there too.
But breaking with Meyer, Sullivan et al, this is one major reason we shouldn’t measure extreme poverty at <$2/day. Instead, we propose 10% of medians, and we extensively justify why this is more honest and straightforward.
One thing we do in Table 1 is to follow what I’m calling the “Fremstad Rule” @ShawnFremstad: always report your thresholds. One way some claim there is no poverty is by drawing line so low that people above are surely poor. Be skeptical of any work not disclosing the threshold.
• • •
Missing some Tweet in this thread? You can try to
force a refresh


