
US Update: 10/19/20
Graph 1: Daily Deaths + Current Hospitalizations
- Hospitalizations bottomed 4 weeks ago and then increased tangibly 2 weeks ago. That new increase trend already started abating the past 4 days
- Reported Deaths down 83 Week-over-Week (WoW)
/1
Graph 1: Daily Deaths + Current Hospitalizations
- Hospitalizations bottomed 4 weeks ago and then increased tangibly 2 weeks ago. That new increase trend already started abating the past 4 days
- Reported Deaths down 83 Week-over-Week (WoW)
/1

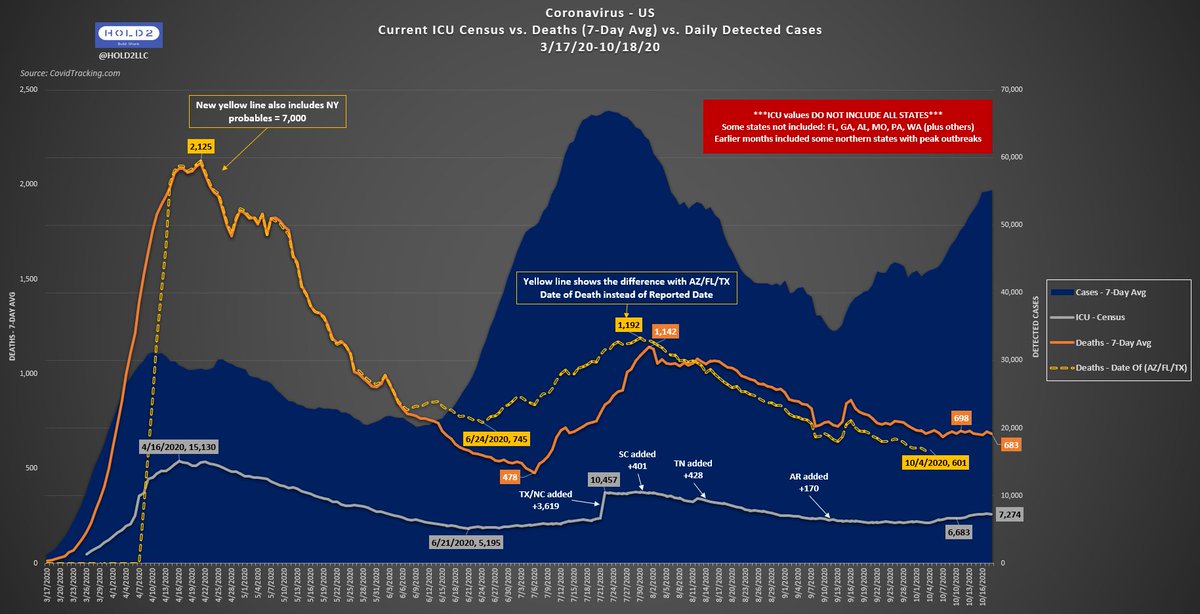
Graph 2: COVID ICU Census vs. Deaths (7DayAvg) vs. Daily Detected Cases
***Case hunting now in mega-hyperdrive and some states now include antigen positives (not antibody)
- 7-Day-Avg Reported Deaths down 15 WoW
- ICUs sizable jump last 2 weeks but peaking again already
/2
***Case hunting now in mega-hyperdrive and some states now include antigen positives (not antibody)
- 7-Day-Avg Reported Deaths down 15 WoW
- ICUs sizable jump last 2 weeks but peaking again already
/2
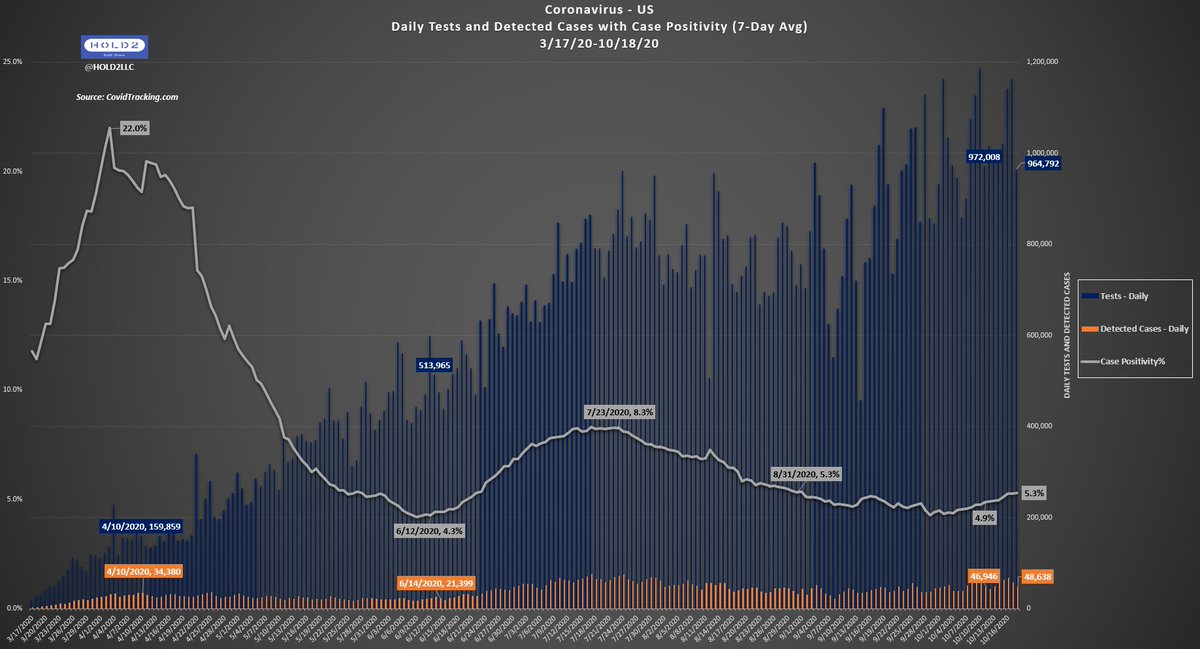
Graph 3: Daily Tests + Detected Cases + Case Positivity
***Last 10+ days have seen a real increase in Pos% that coincides with a bump in national CLI
- Test Positivity up 1.0 from trough
- Daily Test avg above 1M for 26 days
- Increase rate much lower than June surge
/3
***Last 10+ days have seen a real increase in Pos% that coincides with a bump in national CLI
- Test Positivity up 1.0 from trough
- Daily Test avg above 1M for 26 days
- Increase rate much lower than June surge
/3
Graph 4: Coronavirus - Census for Hospitalizations vs. ICUs vs. Ventilators
***All metrics bottomed out early October and then started rising tangibly but already slowing
- Hosps up 7,800 from trough
- ICUs up 1,300 from trough
- Vents up 280 from trough but 220 below July
/4
***All metrics bottomed out early October and then started rising tangibly but already slowing
- Hosps up 7,800 from trough
- ICUs up 1,300 from trough
- Vents up 280 from trough but 220 below July
/4

Graphs 5: Daily Estimated Cases vs. Deaths
This chart does a better job of showing recent case increases in the context of test quantity. Notice orange (detected cases) almost matches the July peak, but blue (Estimated Cases based on 1.2M tests) is much lower.
/5
This chart does a better job of showing recent case increases in the context of test quantity. Notice orange (detected cases) almost matches the July peak, but blue (Estimated Cases based on 1.2M tests) is much lower.
/5

With national CLI increasing slightly from national low, the increase in cases and subsequent increase in Hosps/ICUs/Vents look real.
However, the magnitude of this increases appears much lower than March/June and may already be peaking.
Deaths likely to follow ICU trend.
/END
However, the magnitude of this increases appears much lower than March/June and may already be peaking.
Deaths likely to follow ICU trend.
/END
• • •
Missing some Tweet in this thread? You can try to
force a refresh


