
A thread on what we can learn about polarization of opinions from a simple behavioral network model.
Remember the DeGroot model? It says you decide what to think tomorrow by taking an average of what you and your friends think today.
Examples:
1/
Remember the DeGroot model? It says you decide what to think tomorrow by taking an average of what you and your friends think today.
Examples:
1/
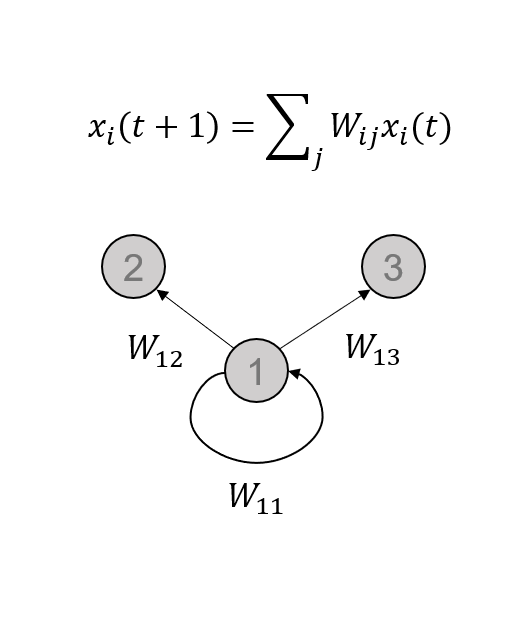
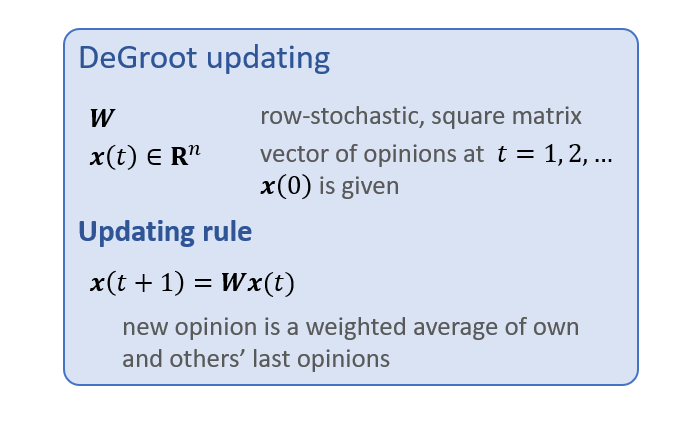
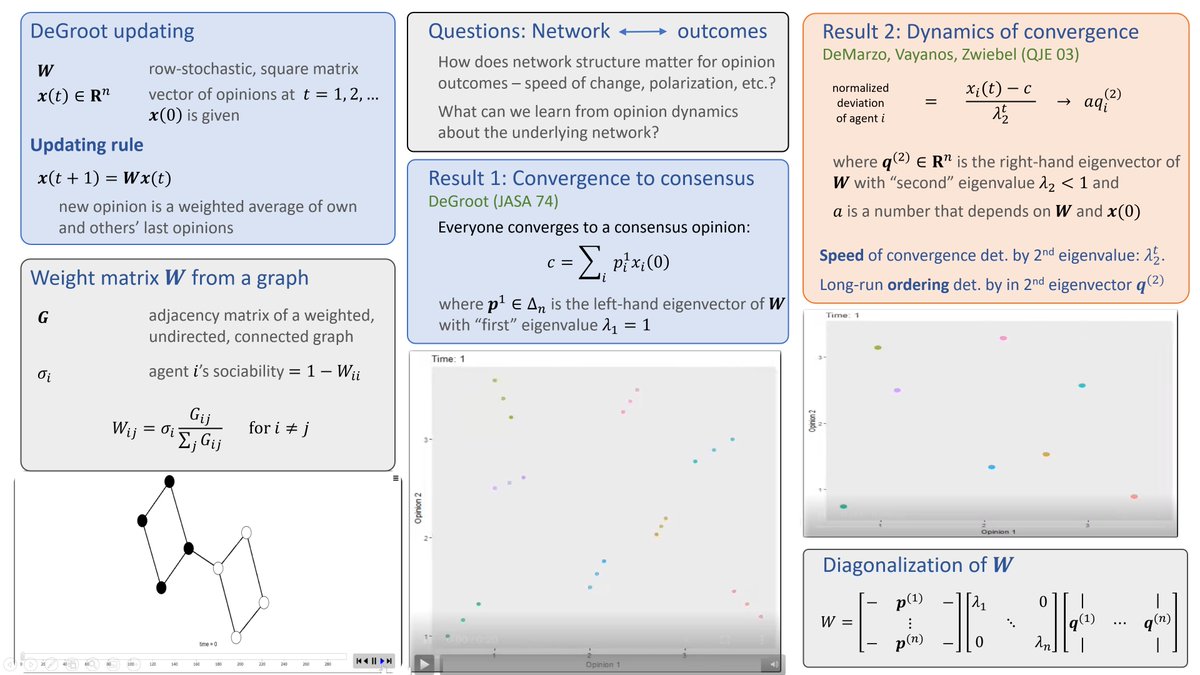
Here is a condensed way of writing it using vector notation, which turns out to be very useful!
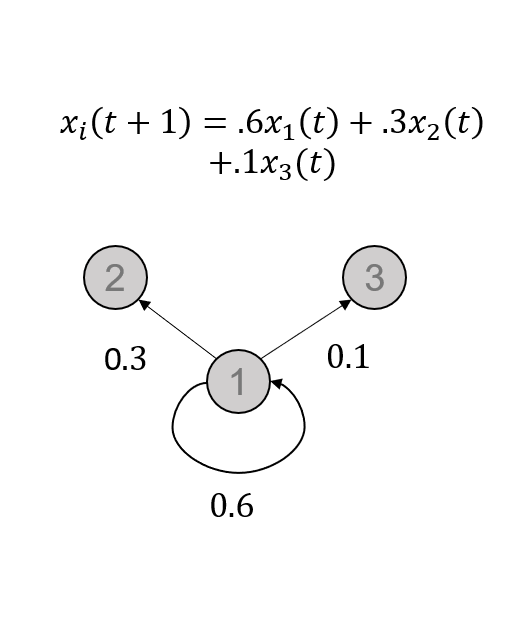
Here W has no negative entries, and each row sums to 1 (that's called "row-stochastic"). That makes sense, since each person is averaging others' views.
2/
Here W has no negative entries, and each row sums to 1 (that's called "row-stochastic"). That makes sense, since each person is averaging others' views.
2/
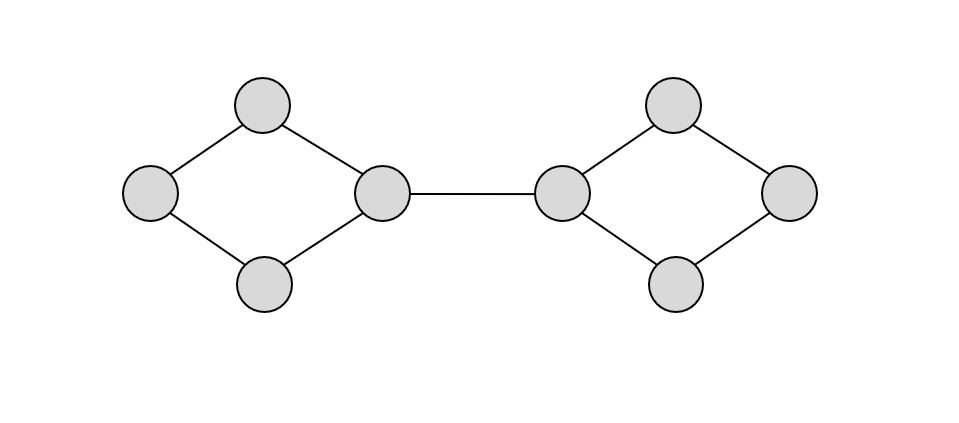
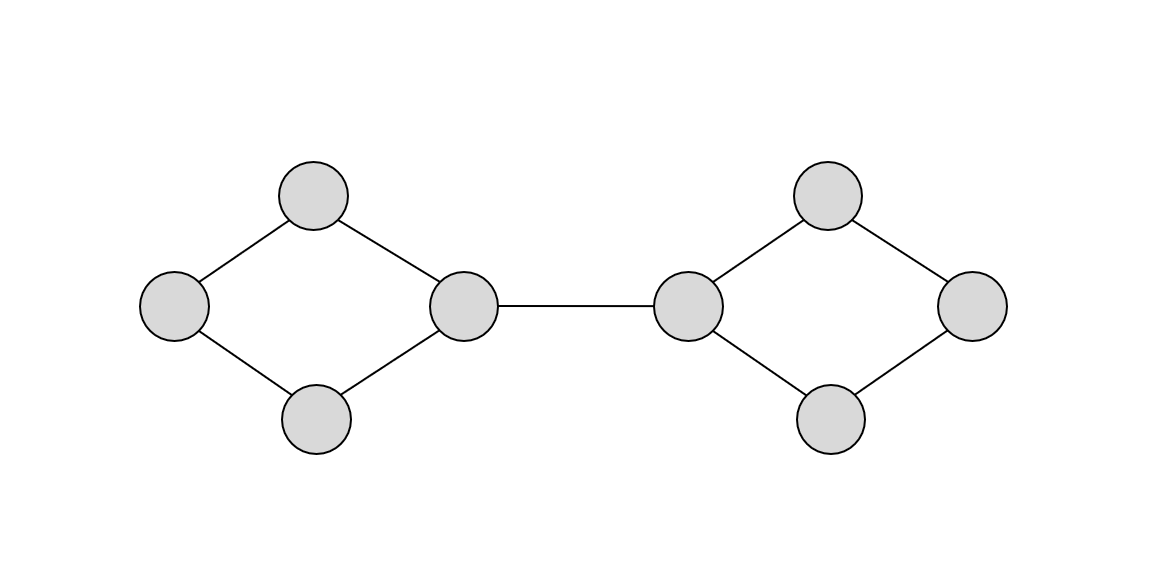
We often want to think of the weights as coming from a social network, maybe something like this. The network tells you who are the friends that you listen to.
So we'd better establish a way of thinking of the updating weights as coming from a network.
3/
So we'd better establish a way of thinking of the updating weights as coming from a network.
3/
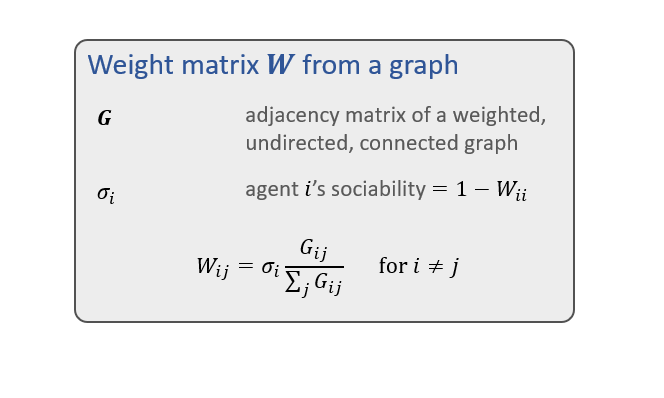
Here's a simple way: let G be the adjacency matrix of the graph, and think of the weights describing that you listen to someone in proportion to your "sociability," and the strength of the relationship between the two of you.
So now we can make W's from graphs, great!
4/
So now we can make W's from graphs, great!
4/
Maybe you would like to see the DeGroot process in action on a graph. Fortunately the awesome @vasu_maybe and @rawatanoop made videos!
Here we set sociability the same for everyone. The color of a node reflects its current opinion, where 0=white and 1=black.
5/
Here we set sociability the same for everyone. The color of a node reflects its current opinion, where 0=white and 1=black.
5/
Now there's a lot to notice here but I want to call your attention to one thing:
notice that the two "communities" start out pretty diverse internally. Each quickly gets pretty similar inside in their opinions.
Differences ACROSS persist for much longer. Look:
6/
notice that the two "communities" start out pretty diverse internally. Each quickly gets pretty similar inside in their opinions.
Differences ACROSS persist for much longer. Look:
6/
You could tell there are two opinion groups here even if I hadn't shown you the graph.
We want to understand how that works: who "clumps up" together, and how long it takes for their differences to dissolve.
7/
We want to understand how that works: who "clumps up" together, and how long it takes for their differences to dissolve.
7/
More broadly when we study this type of model, we want to link network structure to outcomes!
How does network structure matter for opinion outcomes – how fast they change, polarization, etc.?
What can we learn from opinion dynamics about the underlying network?
8/
How does network structure matter for opinion outcomes – how fast they change, polarization, etc.?
What can we learn from opinion dynamics about the underlying network?
8/
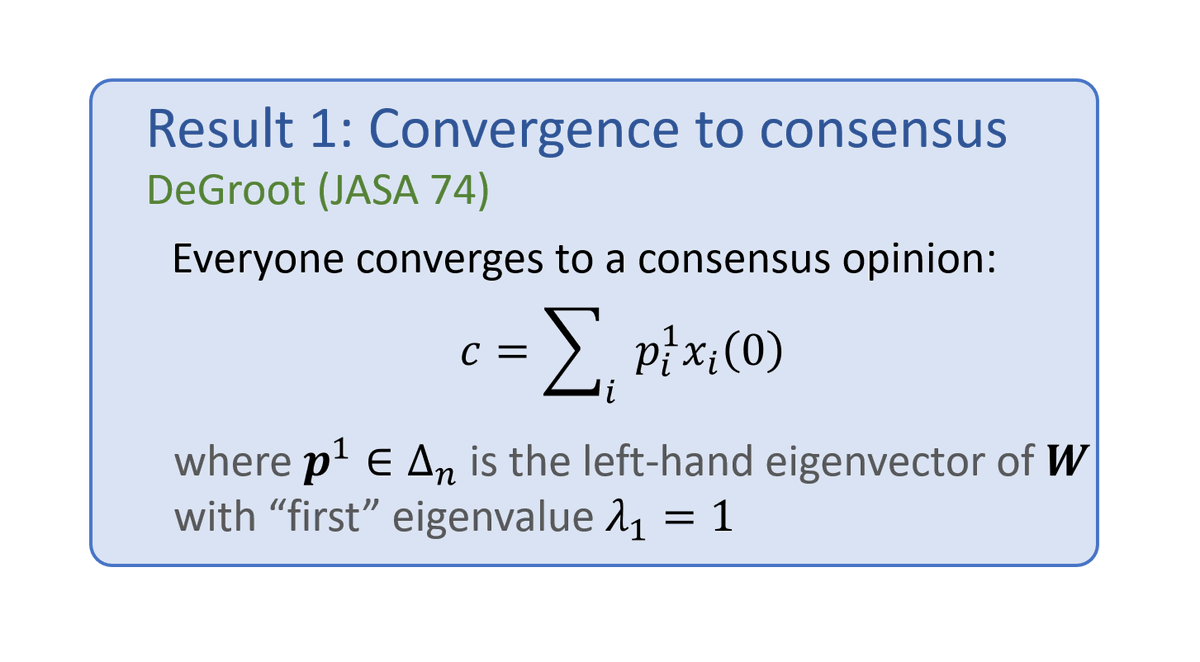
Let's get one piece of housekeeping out of the way. If the underlying network is connected, opinions eventually converge. After all, people keep adjusting toward others!
There's a nice and pretty theory of what they converge to, but that's not the story we're telling today.
9/
There's a nice and pretty theory of what they converge to, but that's not the story we're telling today.
9/
Today, I'm interested in what they're doing on the way.
Let's watch these people talk about TWO issues according to the same model - say, immigration and abortion, starting from arbitrary initial opinions. We'll plot their opinions on two axes.
10/
Let's watch these people talk about TWO issues according to the same model - say, immigration and abortion, starting from arbitrary initial opinions. We'll plot their opinions on two axes.
10/
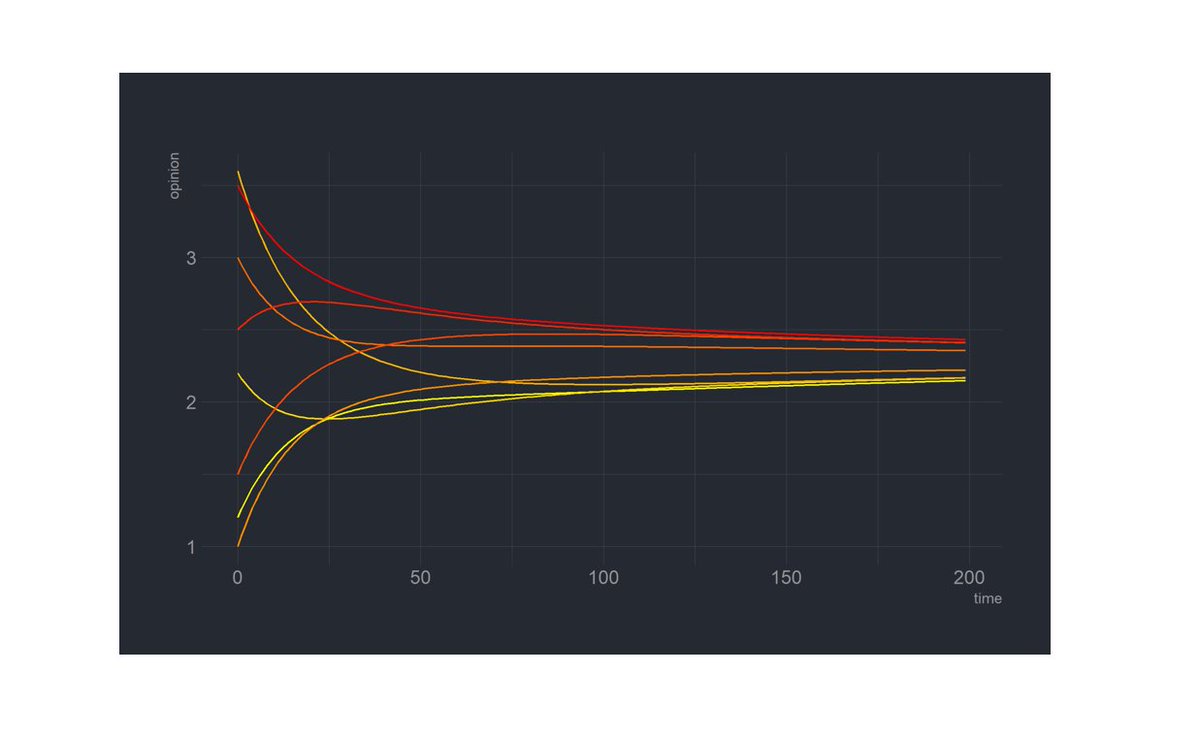
Look at what's happening! They seem to be lining up on one "axis." (Here it looks almost vertical.)
Let's zoom in very close as they're converging (using a different scale for each axis so we can get a good look). We see them lining up on an axis and clumping up a bit.
11/
Let's zoom in very close as they're converging (using a different scale for each axis so we can get a good look). We see them lining up on an axis and clumping up a bit.
11/
There are two questions here:
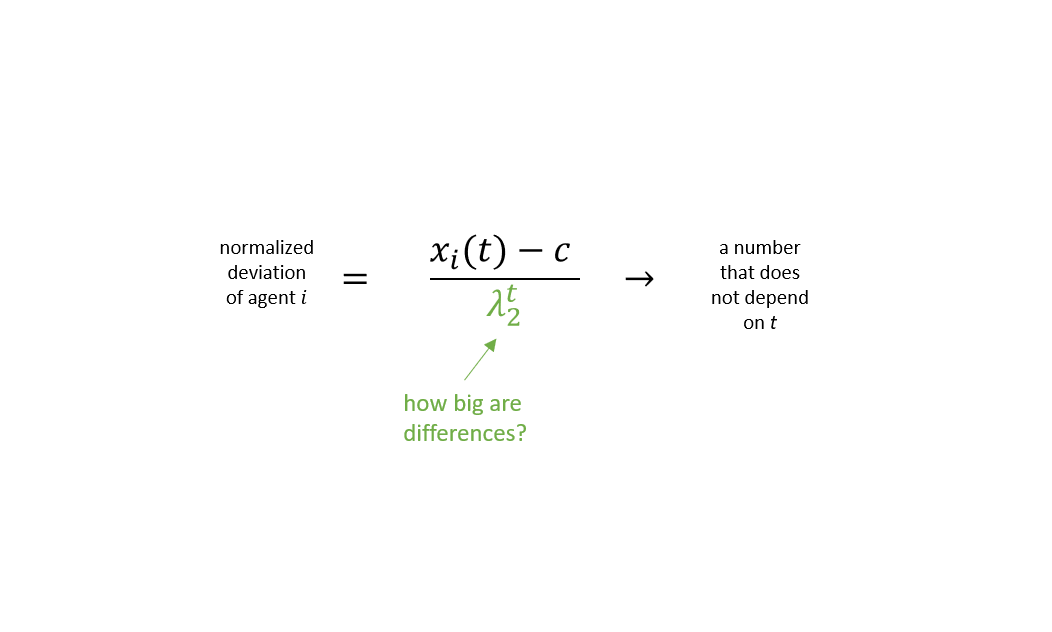
(1) How fast does diversity of opinions decay? That's the zoomed-out picture.
(2) What do opinions look like on the way? That's the zoomed-in picture.
Basic linear algebra gives us a fairly complete answer, which will state and then unpack.
(1) How fast does diversity of opinions decay? That's the zoomed-out picture.
(2) What do opinions look like on the way? That's the zoomed-in picture.
Basic linear algebra gives us a fairly complete answer, which will state and then unpack.
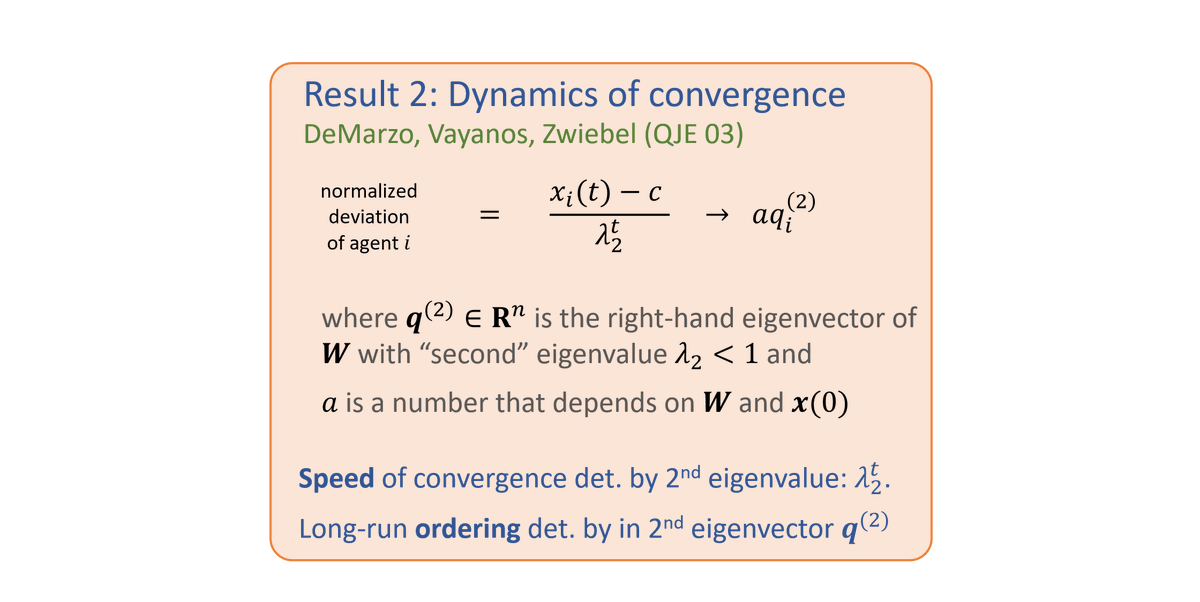
The green thing is the answer to (1). The SIZE of the differences is determined by a certain eigenvalue of the network W - the second-largest one. The bigger it is, the slower we converge.
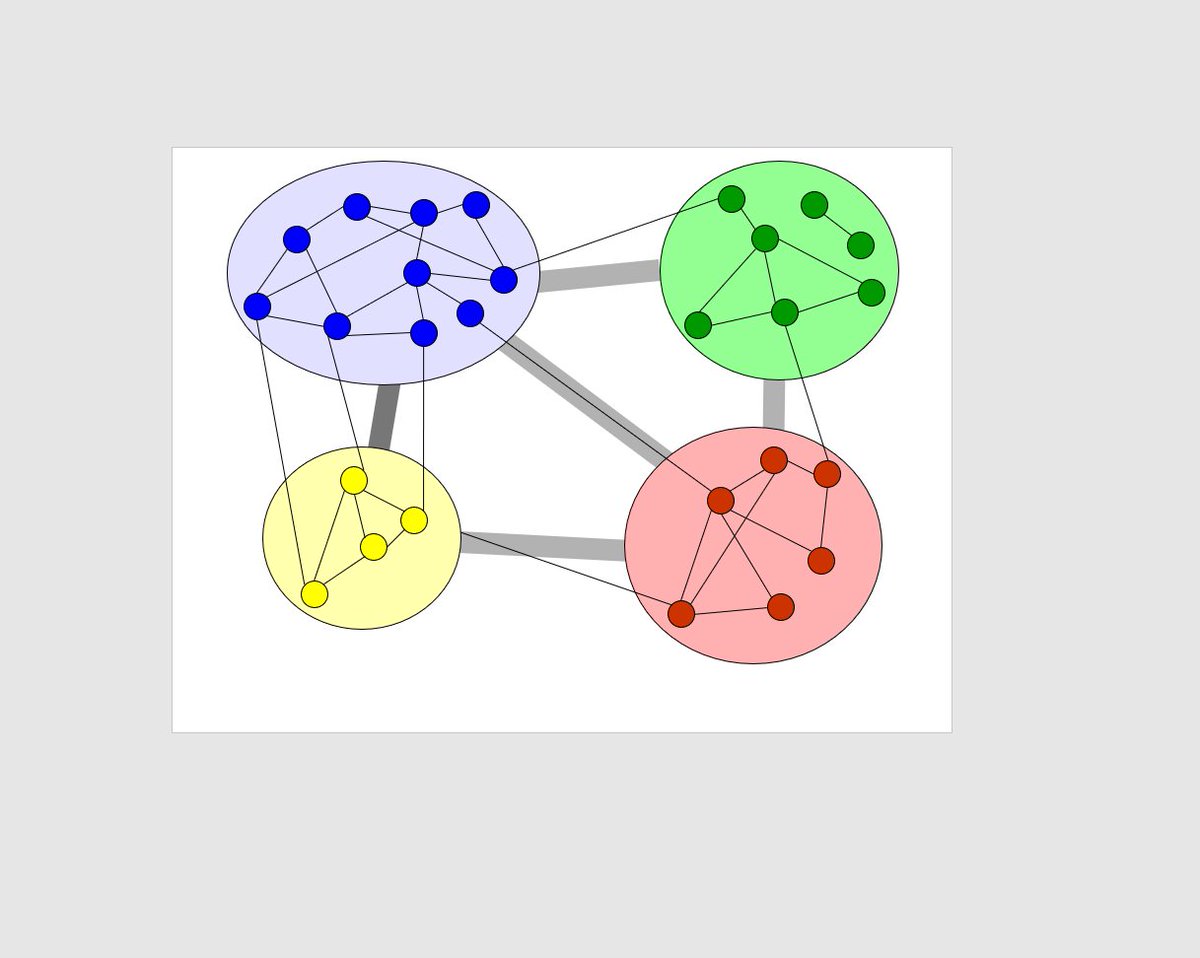
Bigger second eigenvalues happen when networks consist of well-separated communities
13/
Bigger second eigenvalues happen when networks consist of well-separated communities
13/
Our network has a pretty big second eigenvalue, and this one would, too: it could sustain opinion differences for a long time.
Tight communities do that: they can come to a partial consensus inside, and maintain differences across. That's what we saw in the animations.
14/
Tight communities do that: they can come to a partial consensus inside, and maintain differences across. That's what we saw in the animations.
14/
When we divide by λ₂ to the power t, we are zooming in at a rate that keeps the picture looking constant - so we are now trying to understand the structure of disagreement, not its scale. The thing in this zoomed-in animation.
The rest of the DVZ result tells us all about that.
The rest of the DVZ result tells us all about that.
Here's what's going on with that, on the right-hand side: everyone has a "position." That is, on any issue, you can be put on a "spectrum" just based on the network. And on any issue, that's where you'll be. Centrist on abortion? Centrist on immigration. Due to q^(2).
16/
16/
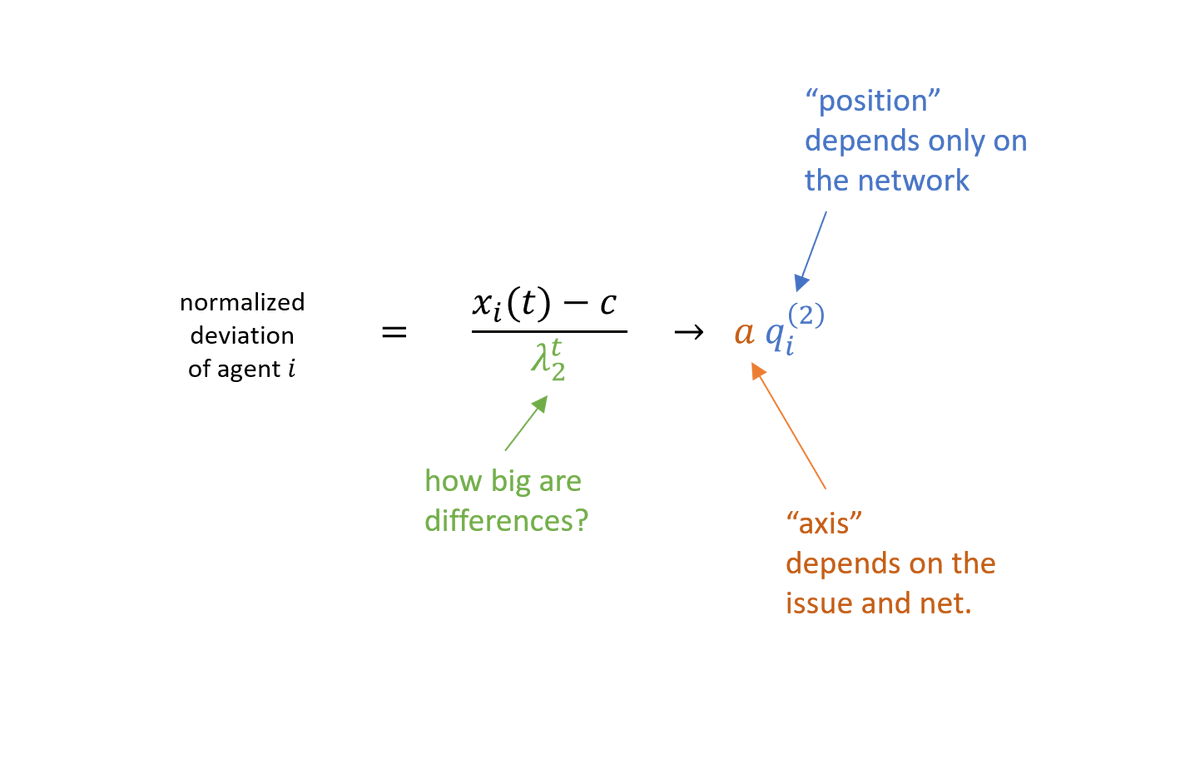
In our running example, the positions are actually basically just the horizontal locations of people in the picture as drawn!
The initial configuration of opinions on the issue "only" determines a, the "sign" and "scale" of how we line up on the issue.
17/
The initial configuration of opinions on the issue "only" determines a, the "sign" and "scale" of how we line up on the issue.
17/
In this illustration we started with those on the left having dark (low) opinions and those on the right having light (high) ones, so a is positive: "right" correlates with "light."
If we'd started with an opposite opinion configuration on the same network, a would be negative.
If we'd started with an opposite opinion configuration on the same network, a would be negative.
Relatedly, the larger the initial disagreement between the two groups, the bigger disagreement will be eventually: that's an obvious scaling.
a captures that too.
Each dimension (immigration, abortion) has its own a, and together they determine the axis we saw in the videos.
19
a captures that too.
Each dimension (immigration, abortion) has its own a, and together they determine the axis we saw in the videos.
19
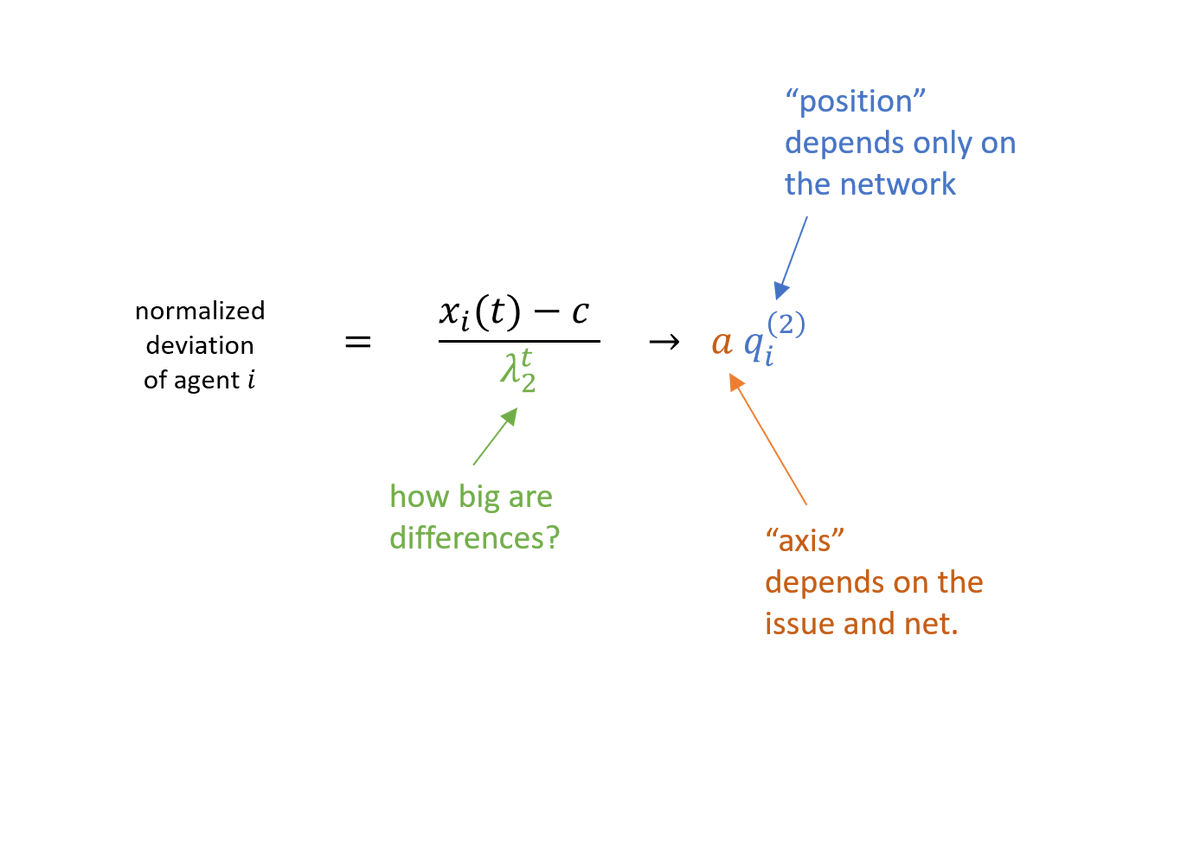
In this example, the axis ends up sloping north-north-east -- that's determined by the a's of the two issues. The positions along that axis are determined by the q's.
20/
20/
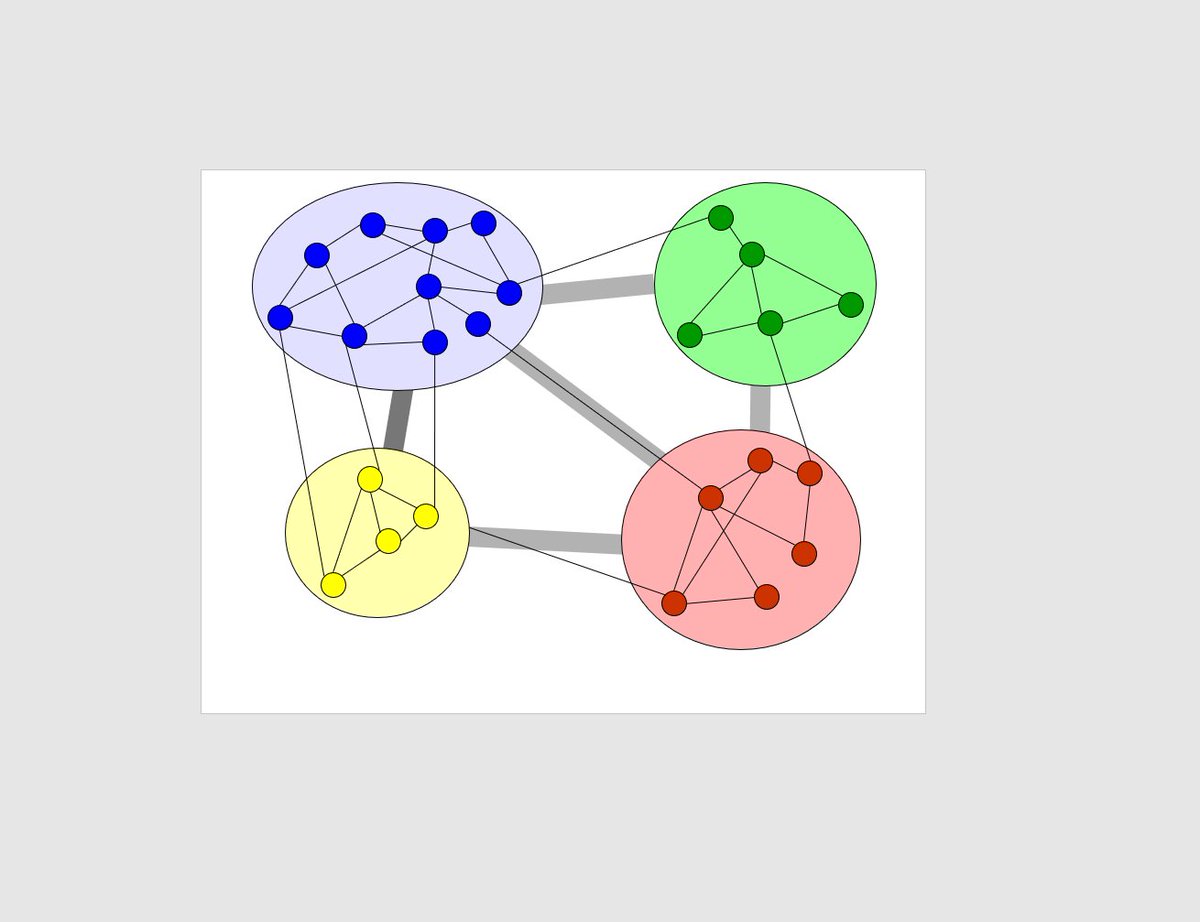
One last thing: you might think that either of the examples in the pictures below, which (visual) "chunk" of the network you are in will determine a lot about your q. That is, positions along the axis will clump in groups. That turns out to be true!
21/
21/
Making that rigorous and precise is a story for another day. For now, let me close with some basic takeaways.
22/
22/
The almost ridiculously simple DeGroot model delivers that as society is converging to a consensus on controversial issues, the network determines how global discord decays.
The second eigenvalue determines how fast.
23/
The second eigenvalue determines how fast.
23/
A corresponding eigenvector determines where people fall along the axis of most durable disagreement. When there is a "community structure" to the network, long-run positions are very correlated with community identity.
A lot from a simple model!
24/
A lot from a simple model!
24/
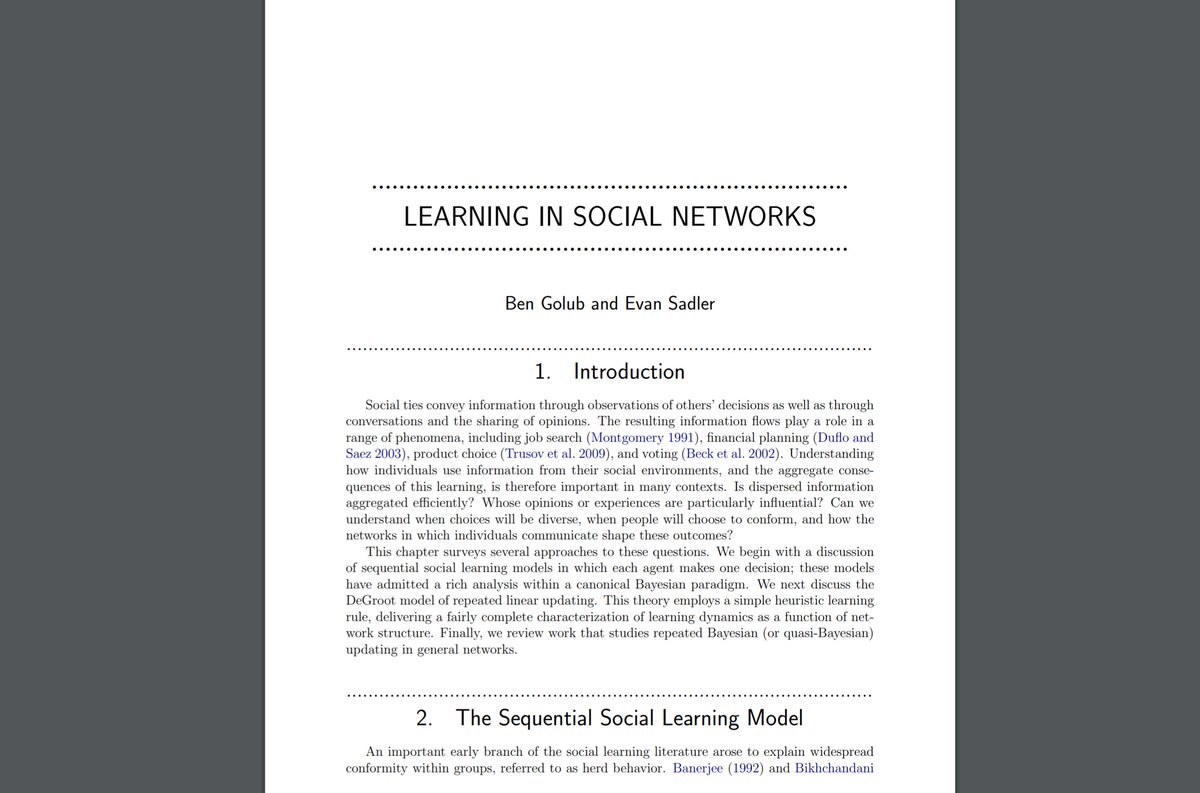
For more on all this, see Section 3 of this survey.
bengolub.net/papers/survey.…
A huge thank you to @rawatanoop and @vasu_maybe who made it possible to tell this story, and to many collaborators who have explained this stuff to me over the years, especially @JacksonmMatt
25/25
bengolub.net/papers/survey.…
A huge thank you to @rawatanoop and @vasu_maybe who made it possible to tell this story, and to many collaborators who have explained this stuff to me over the years, especially @JacksonmMatt
25/25
PS/ Everything together
• • •
Missing some Tweet in this thread? You can try to
force a refresh


