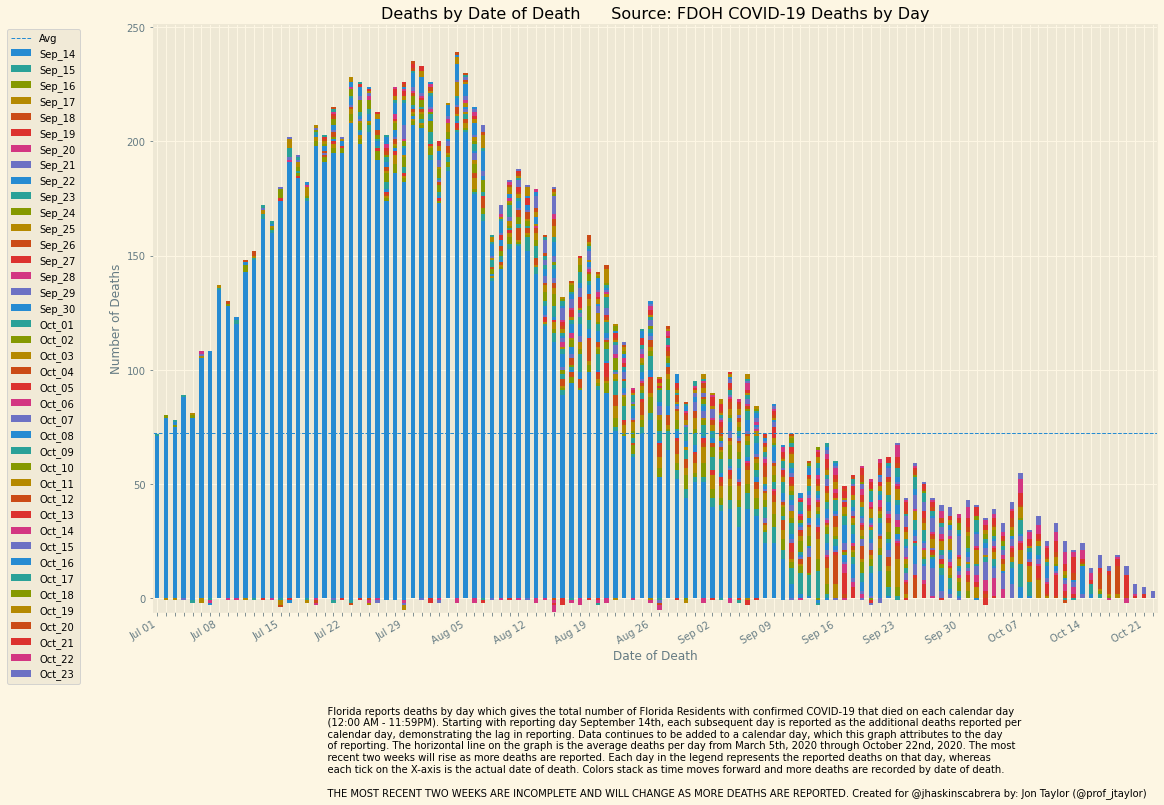
Florida reported a net of 57 deaths today. Changes were reported on 34 different days, going back to June 24.
June (+1-1), August (+1-1), September (+17-3), October(+46-3)
#RationalGround
1/7
June (+1-1), August (+1-1), September (+17-3), October(+46-3)
#RationalGround
1/7

Peaks are 7/30 (235) & 8/4 (237); the 7-day moving average peak is 8/5 (225).
The 7-day average plateau between 7/25 and 8/7 has been stable since August 27.
Here is the full graph for context:
2/7
The 7-day average plateau between 7/25 and 8/7 has been stable since August 27.
Here is the full graph for context:
2/7

Yesterday's deaths (as best we could find them - read bottom of the chart for more details):
Median age: 73.5
Minimum age: 50
Maximum age: 98
76% are 65 or older
3/7
Median age: 73.5
Minimum age: 50
Maximum age: 98
76% are 65 or older
3/7

New deaths by date:
10/20 - 1
10/19 - removed 2
10/18 - 1
10/17 - removed 1
10/15 - 3
10/14 - 4
10/13 - 2
10/12 - 5
10/11 - 4
10/10 - 1
10/9 - 4
10/8 - 3
10/7 - 6
10/6 - 1
10/5 - 2
10/4 - 2
10/3 - 2
10/1 - 5
9/30 - 2
9/28 - 3
9/27 - 1
9/25 - 1
9/24 - 1
9/23 - 5
(more)
4/7
10/20 - 1
10/19 - removed 2
10/18 - 1
10/17 - removed 1
10/15 - 3
10/14 - 4
10/13 - 2
10/12 - 5
10/11 - 4
10/10 - 1
10/9 - 4
10/8 - 3
10/7 - 6
10/6 - 1
10/5 - 2
10/4 - 2
10/3 - 2
10/1 - 5
9/30 - 2
9/28 - 3
9/27 - 1
9/25 - 1
9/24 - 1
9/23 - 5
(more)
4/7
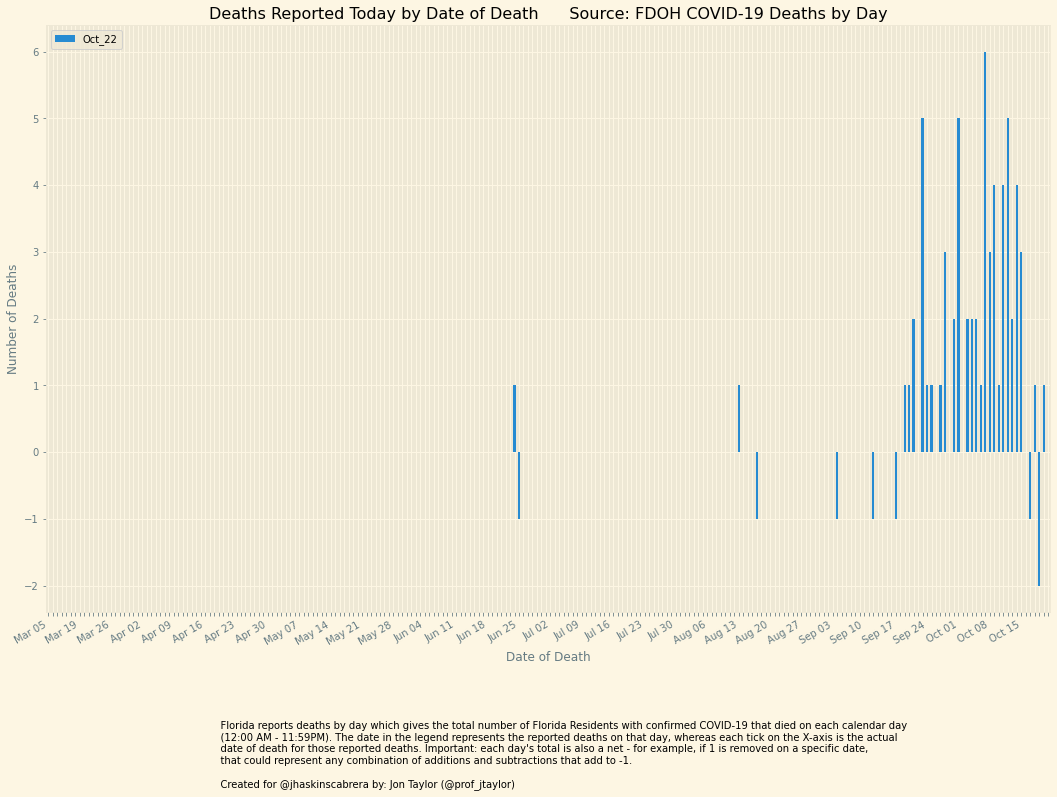
9/21 - 2
9/20 - 1
9/19 - 1
9/17 - removed 1
9/12 - removed 1
9/4 - removed 1
8/17 - removed 1
8/13 - 1
6/25 - removed 1
6/24 - 1
These are not totals by day; they're increments added today. See the chart in the first tweet for totals.
5/7
9/20 - 1
9/19 - 1
9/17 - removed 1
9/12 - removed 1
9/4 - removed 1
8/17 - removed 1
8/13 - 1
6/25 - removed 1
6/24 - 1
These are not totals by day; they're increments added today. See the chart in the first tweet for totals.
5/7
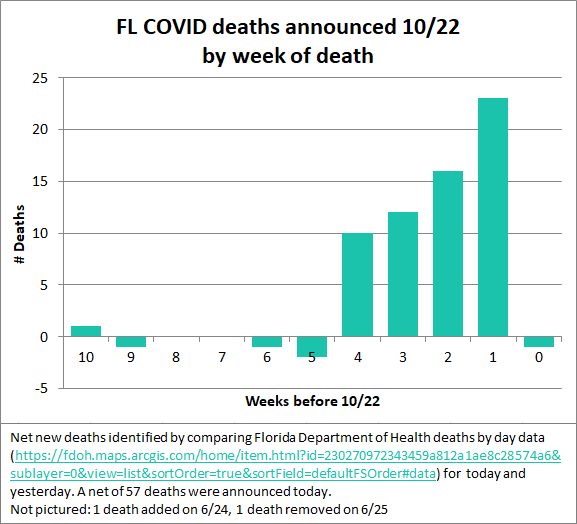
It's important to note that each day's total is also a net - for example, if 1 is removed on a specific date, that could represent any combination of additions and subtractions that add to -1.
6/7
6/7
Sources: Florida deaths by day: fdoh.maps.arcgis.com/home/item.html…
My spreadsheet to track changes: docs.google.com/spreadsheets/d…
7/7
My spreadsheet to track changes: docs.google.com/spreadsheets/d…
7/7
• • •
Missing some Tweet in this thread? You can try to
force a refresh

