Now that we are closing in on the end of October there is an opportunity to look back at the data from Ireland’s Level 3 restrictions to determine: was it working; why we needed to move to L5; and what this means for the future.
(1/12)
link.medium.com/Wj7KAIHpXab
Here's the county transmission picture from Oct 7, at the start of L3. We want to be in the lower-left quadrant (low & falling transmission rates) but counties are mostly spread across the upper-right (high and rising transmission rates). Not good.
(2/12) Image
However, by Oct 18 things had improved, at least in the sense that transmission rates were falling. Most counties were on the right trajectory now. Good but with room for improvement. But if L3 was working why then the need to move to L5?
(3/12) Image
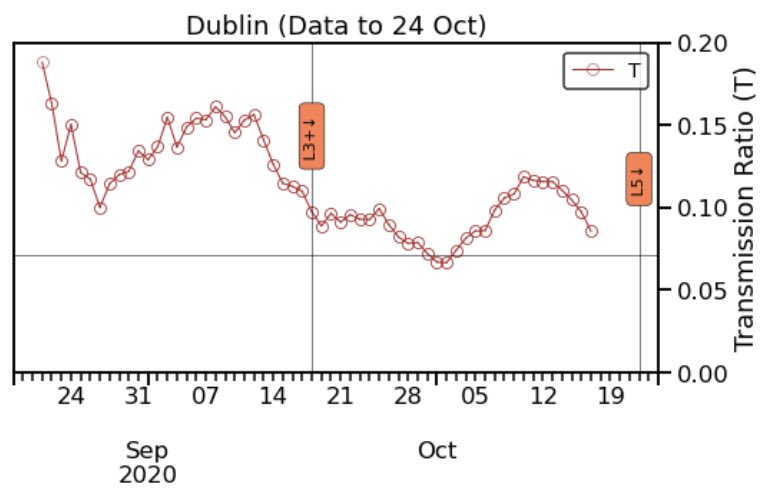
Although most counties were heading in the right direction, progress was slow and sometimes inconsistent. Eg, Dublin's transmission rates (below) had begun to rise during L3. If it happened in Dublin it could happen elsewhere too. L3 didn't fail us, we failed L3!
(4/12) Image
So here we are in L5, which is especially frustrating since most of us feel we have been doing everything that has been asked of us for months. Is it really the case that to bring transmission down we need a full lockdown? Is this our future? Perhaps not ...
(5/12)
A characteristic of this virus is that it's transmission is unevenly distributed. This is called overdispersion, and it is superbly discussed by @zeynep of @TheAtlantic in theatlantic.com/health/archive…
(6/12)
Seasonal influenza is more or less evenly transmitted but SARS-CoV-2 is not, so its R num only tells part of the story. It is why we have superspreading events.

Overdispersion can make it hard for the virus to take hold but when it does it can really explode.
(7/12)
For SARS-CoV-2, 80% of cases can be caused by 10% of individuals this may be why, in part at least, we have not been successful in controlling it of late and why we are in L5 today, even though most people have been diligently observing the guidelines for months.
(8/12)
If 80% of cases can be produced by 10% of individuals, then it’s not enough for a majority follow the guidelines, because the small minority who don't can generate a disproportionate number of cases.

The good deeds of the many can’t make up for the misdeeds of the few.
(9/12)
This also has implications for contact tracing. Instead of tracing the close contacts of a newly infected case, from the time of their infection (forward tracing), we should identify the original source of the newly infected case (backward tracing) & work from there ...
(10/12)
@AdamJKucharski discusses how this backward tracing approach can help to identify 3-10x as many infections and avert 2-3x as many new cases, compared with more conventional forward tracing; see wellcomeopenresearch.org/articles/5-239
(11/12)
In the article below I discuss these matters and more, including some concrete suggestions for how we might plan to exit L5 safely ... for good this time!
(12/12)

link.medium.com/Wj7KAIHpXab

• • •

Missing some Tweet in this thread? You can try to force a refresh
 

Keep Current with barrysmyth

barrysmyth Profile picture

Stay in touch and get notified when new unrolls are available from this author!

Read all threads

This Thread may be Removed Anytime!

PDF

Twitter may remove this content at anytime! Save it as PDF for later use!

Try unrolling a thread yourself!

how to unroll video
  1. Follow @ThreadReaderApp to mention us!

  2. From a Twitter thread mention us with a keyword "unroll"
@threadreaderapp unroll

Practice here first or read more on our help page!

More from @barrysmyth

3 Nov
How are things going in Level 5? Cases and positivity rates are coming down nicely. How does this compare to wave 1 and can this help us to predict where we might get to by December? Let’s have a look ...
(1/n) Image
I’ve aligned waves 1 & 2 using their peaks. The y-axis is the 7d moving average of daily cases as a fraction of each wave’s peak. Wave 1 peaked at ~872 c/d and came down to about 50 c/d by June. So far, wave 2 has peaked at 1169 c/d & its falling. Where will it fall to?
(2/n) Image
Next, I (naively) extend wave 2 using the corresponding portion of wave 1; very simple yes, but probably a reasonable, if optimistic, estimate that saves on the modelling.

It suggests that we will get to about 144 cases/day on Dec 4.
(3/n) Image
Read 5 tweets
2 Nov
Slovakia's drive to test its entire population over 2 weekends got off to a good start on Saturday with 2.5m tested and 1% positivity. Those 25k positives are now in quarantine. A voluntary programme with opt-outs required to quarantine for 10 days.
(1/n)
theguardian.com/world/2020/nov…
Next weekend the second half will be completed and presumably another ~25k positive cases will be found. So approx. 50k people will be in quarantine for 10-14 days. The remaining >5.4m people will presumably be free to go about their business with limited restrictions. (2/n)
There will be false positives among the 50k positives, possibly a fair few of them, but the alternative is that everyone goes into lockdown so this seems like a reasonable trade-off. There will also be false negatives circulating but there shouldn't be too many of them. (3/n)
Read 17 tweets
1 Nov
This seems like an interesting experiment. Slovakia is testing entire population (5m) over 2 w/ends. Testing is ‘voluntary’ but those not participating must self-isolate for 10d. The first round covered 1m people with 1% positivity.
(1/n) @dwnews
In theory, absent issues with false negatives, could an approach like this drive the virus out of a country within a couple of weeks after testing? Imperfect because of false negatives and secondary tx during isolation, but it would surely do more than 6 was in L5 (for all) (2/n)
Eg, assume 1% positive rate from round 1 is correct, then Slovakia will end up with 50k people in isolation for 10-14days after a full testing cycle. After that cases will be the false negatives & secondary tx during isolation. (3/n)
Read 6 tweets
1 Nov
We can now see transmission rates after L3, as we began L5. Much better than start of L3. Almost all counties either in or near the lower-left quadrant (low transmission & falling). A great good from which L5 can do its work if we all do out bit.
link.medium.com/z5HrNtUB3ab Image
Here’s the same picture from just a few days ago ... we were moving in the right direction but still more to do. Image
And back at the start of L3 it was much worse again because by and large most counties had high and rising transmission rates (upper-right quadrant). So we have come some distance already ... Image
Read 4 tweets

Did Thread Reader help you today?

Support us! We are indie developers!


This site is made by just two indie developers on a laptop doing marketing, support and development! Read more about the story.

Become a Premium Member ($3/month or $30/year) and get exclusive features!

Become Premium

Too expensive? Make a small donation by buying us coffee ($5) or help with server cost ($10)

Donate via Paypal Become our Patreon

Thank you for your support!

Follow Us on Twitter!