barrysmyth Profile picture
Prof Computer Science (UCD), AI researcher, ex-entrepreneur (who still likes to help), data-obsessed, runner & geek-dad. All started with a ZX81.
Jun 2, 2022 12 tweets 6 min read
I teach a 15-credit course to 3rd yr #datascience ugrads @UCD. I've their full attention for ~10 wks. They work in pairs to produce a major project of their own design. Every year I'm amazed by how they grow during this time & the confidence they gain from what they achieve. 1\n At the start of the module we've a 1-wk bootcamp where I work on a sample project from start to finish. Each year I pick a new topic & this year it was an analysis of #Wordle, the popular @nytime word puzzle. Here's a summary of the key findings... 2\n
towardsdatascience.com/big-data-in-li…
Nov 21, 2020 5 tweets 1 min read
Query for immunologists...we need about 70% of the pop. to be vaccinated for herd immunity; ie. at 70% we get R=1. So lets call it 3.5m vaccinations. Can we do 500k/month? So this takes 7 months to achieve? What’s the effect of increasing vaccination levels by 500k/mth on R? 1/ In Jan we will be facing the prospect of a further lockdown as cases will be rising fast. If we start vaccinations in Jan then how will this help the R number. If 70% vaccinations imply R~1, then is there a linear relationship between vaccination level and R? 2\
Nov 21, 2020 10 tweets 4 min read
Some people have been asking about the ‘models’ I used in this graph to make case predictions beyond today. It’s very simple. There isn’t a model, at least not in the complicated way you might think. Wtf?!? Let me explain.
1\ Instead of using a complex predictive model & having a debate about parameters etc. I just used the case trend/numbers from waves 1 (red) & 2 (blue) after aligning the relative case numbers based on their peaks, as shown. Both waves are similar so this makes sense. 2\
Nov 20, 2020 4 tweets 2 min read
Level 5 seems well & truly stuck now, & each day brings a new even higher cases/day ‘prediction’ for an early Dec exit; its now 257 today, up from 223 yesterday. The problem is not only that cases are stalled/rising, but we have less and less time left to fix it before Xmas. 1/ 
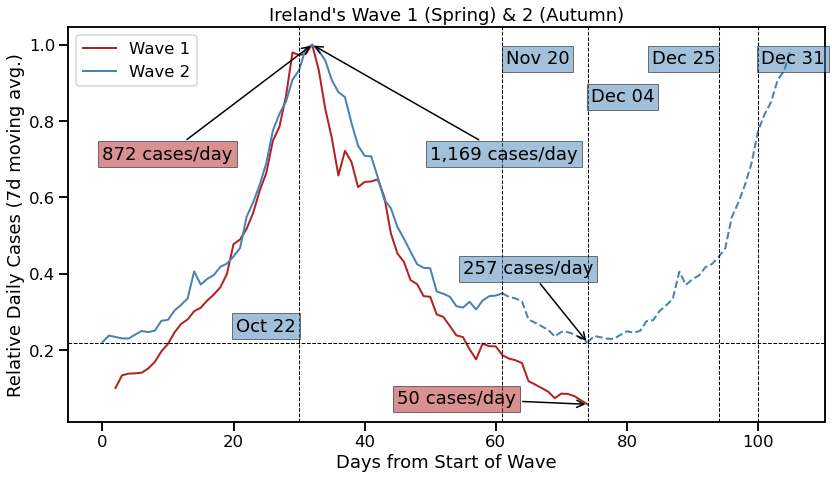
That puts us >500c/d by Dec 25 & >900c/d by Dec 31, but that’s if transmission in Dec is similar to tx in Sept/Oct, which is surely very unlikely. Chances are, it will be markedly worse because of Xmas, so we’ll get more cases later in Dec & need a lockdown in early Jan. 2\
Nov 3, 2020 5 tweets 2 min read
How are things going in Level 5? Cases and positivity rates are coming down nicely. How does this compare to wave 1 and can this help us to predict where we might get to by December? Let’s have a look ...
(1/n) I’ve aligned waves 1 & 2 using their peaks. The y-axis is the 7d moving average of daily cases as a fraction of each wave’s peak. Wave 1 peaked at ~872 c/d and came down to about 50 c/d by June. So far, wave 2 has peaked at 1169 c/d & its falling. Where will it fall to?
(2/n)
Nov 2, 2020 17 tweets 4 min read
Slovakia's drive to test its entire population over 2 weekends got off to a good start on Saturday with 2.5m tested and 1% positivity. Those 25k positives are now in quarantine. A voluntary programme with opt-outs required to quarantine for 10 days.
(1/n)
theguardian.com/world/2020/nov… Next weekend the second half will be completed and presumably another ~25k positive cases will be found. So approx. 50k people will be in quarantine for 10-14 days. The remaining >5.4m people will presumably be free to go about their business with limited restrictions. (2/n)
Nov 1, 2020 6 tweets 2 min read
This seems like an interesting experiment. Slovakia is testing entire population (5m) over 2 w/ends. Testing is ‘voluntary’ but those not participating must self-isolate for 10d. The first round covered 1m people with 1% positivity.
(1/n) @dwnews
In theory, absent issues with false negatives, could an approach like this drive the virus out of a country within a couple of weeks after testing? Imperfect because of false negatives and secondary tx during isolation, but it would surely do more than 6 was in L5 (for all) (2/n)
Nov 1, 2020 4 tweets 2 min read
We can now see transmission rates after L3, as we began L5. Much better than start of L3. Almost all counties either in or near the lower-left quadrant (low transmission & falling). A great good from which L5 can do its work if we all do out bit.
link.medium.com/z5HrNtUB3ab Image Here’s the same picture from just a few days ago ... we were moving in the right direction but still more to do. Image
Oct 28, 2020 12 tweets 4 min read
Now that we are closing in on the end of October there is an opportunity to look back at the data from Ireland’s Level 3 restrictions to determine: was it working; why we needed to move to L5; and what this means for the future.
(1/12)
link.medium.com/Wj7KAIHpXab Here's the county transmission picture from Oct 7, at the start of L3. We want to be in the lower-left quadrant (low & falling transmission rates) but counties are mostly spread across the upper-right (high and rising transmission rates). Not good.
(2/12) Image