In this week’s COVID-19 Infection Survey, we are reporting rising numbers of #coronavirus cases across the UK ow.ly/xrkS50C71uN Graphic text: Estimated percentage of people with COVID-19 (
Headline estimates for England suggest infections have continued to rise.

Around 1 in 100 people not in care homes, hospitals or other institutional settings in England would test positive for #COVID19 (at any given time between 17-23 Oct) ow.ly/ixpa50C71xn Chart title: The most recent modelled estimate shows the num
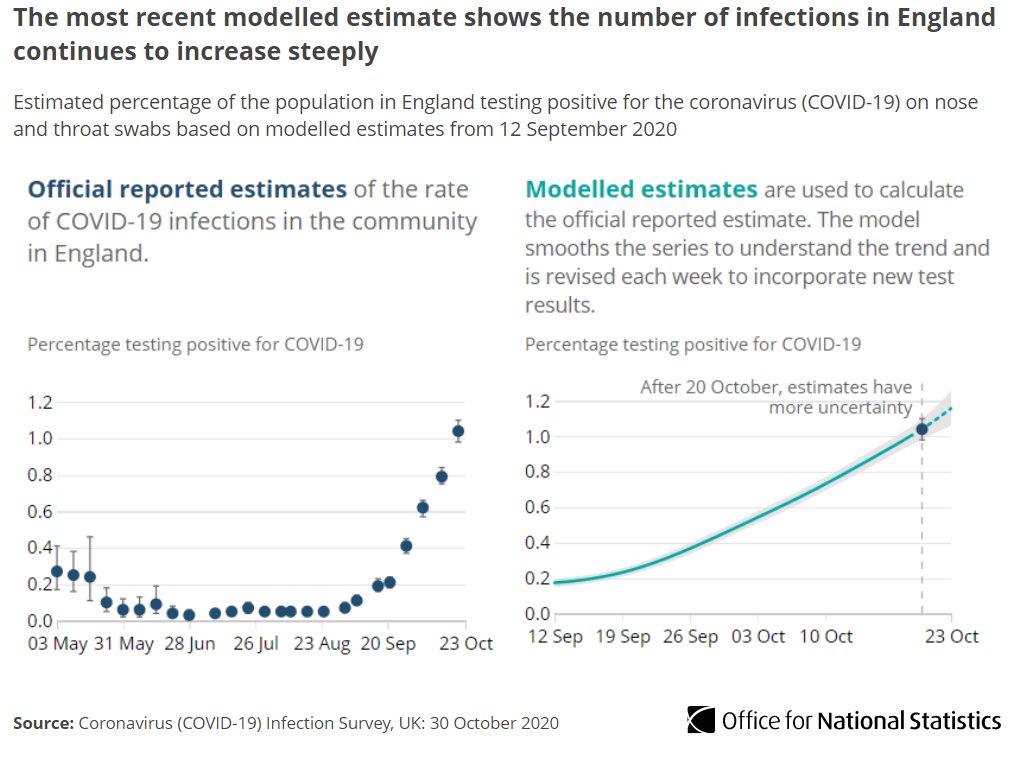
During the most recent week, we estimate there were around 51,900 new #COVID19 infections per day in England ow.ly/ftku50C71E1 Chart title: The incidence rate has continued to increase in
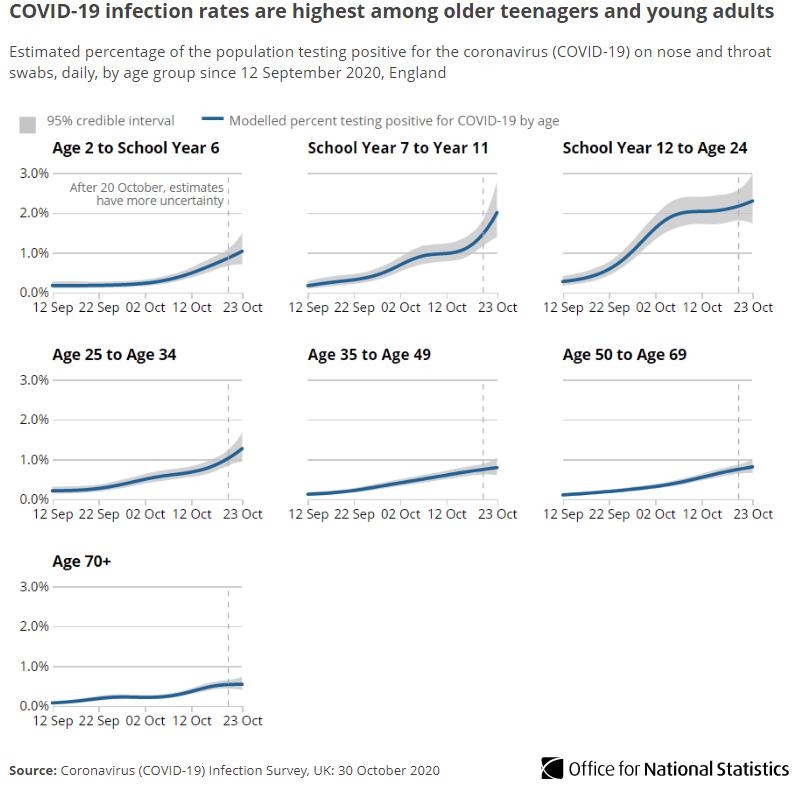
There has been growth in the number of infections in all age groups over the past two weeks

▪️ Older teenagers and young adults continue to have the highest current rates

▪️ Rates also appear to be steeply increasing among secondary school children

➡️ow.ly/epsA50C71Kd Chart title: COVID-19 infection rates are highest among olde
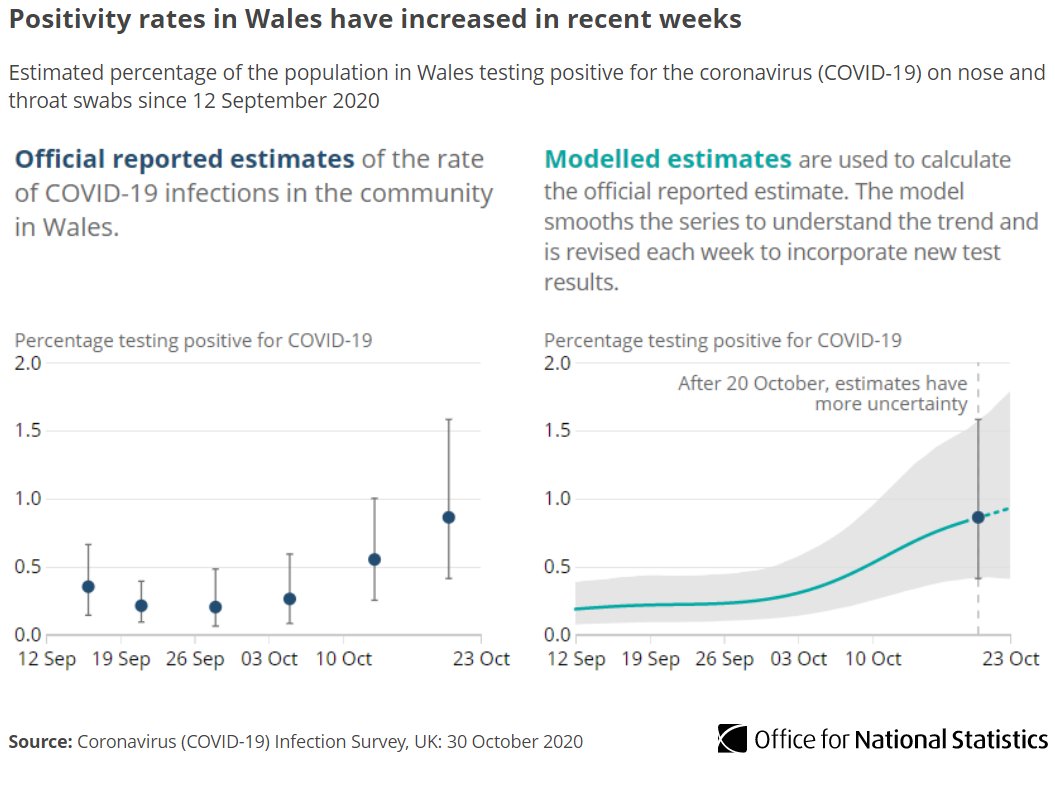
We estimate that in Wales, 26,100 people had #COVID19, or around 1 in 120 people at any given time between 17-23 Oct.

Our modelling also suggests that the number of #COVID19 cases in Wales has increased in recent weeks ow.ly/AA7J50C71Sz Chart title: Positivity rates in Wales have increased in rec
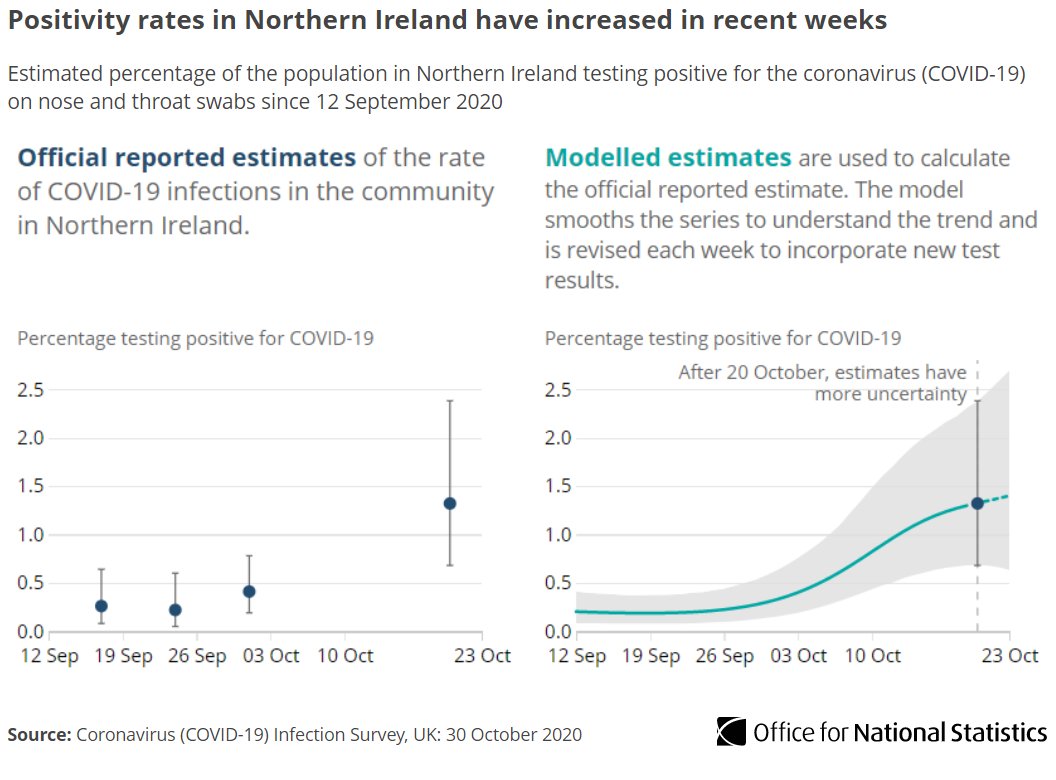
We are also seeing the number of infections rising in Northern Ireland in the most recent weeks.

Our modelling suggests that 24,300 people in Northern Ireland had #COVID19, or around 1 in 80 people at any given time between 17-23 Oct ow.ly/jf9950C71ZJ Chart title: Positivity rates in Norther Ireland have increa
It is too early to say whether infections have increased in Scotland yet.

We estimate that 1 in 140 people in Scotland had #COVID19, equating to 37,400 people (for the most recent two weeks of the study) ow.ly/1oAU50C72os

• • •

Missing some Tweet in this thread? You can try to force a refresh
 

Keep Current with Office for National Statistics (ONS)

Office for National Statistics (ONS) Profile picture

Stay in touch and get notified when new unrolls are available from this author!

Read all threads

This Thread may be Removed Anytime!

PDF

Twitter may remove this content at anytime! Save it as PDF for later use!

Try unrolling a thread yourself!

how to unroll video
  1. Follow @ThreadReaderApp to mention us!

  2. From a Twitter thread mention us with a keyword "unroll"
@threadreaderapp unroll

Practice here first or read more on our help page!

More from @ONS

30 Oct
This week’s Opinions and Lifestyle survey took place between 21-25 Oct, after the UK government introduced local #COVID19 alert levels in England on 12 Oct.

Responses from Wales came both before and after the Coronavirus “firebreak” rules on 23 Oct ow.ly/UAH350C6Uua Graphic text: Coronavirus and the social impacts on Great Br
We asked adults in England which of the three local COVID alert levels they were in:

▪️ Nearly half (48%) said they were in tier 1
▪️ 37% in tier 2
▪️ 10% in tier 3

➡️ ow.ly/C9ZV50C6UxU
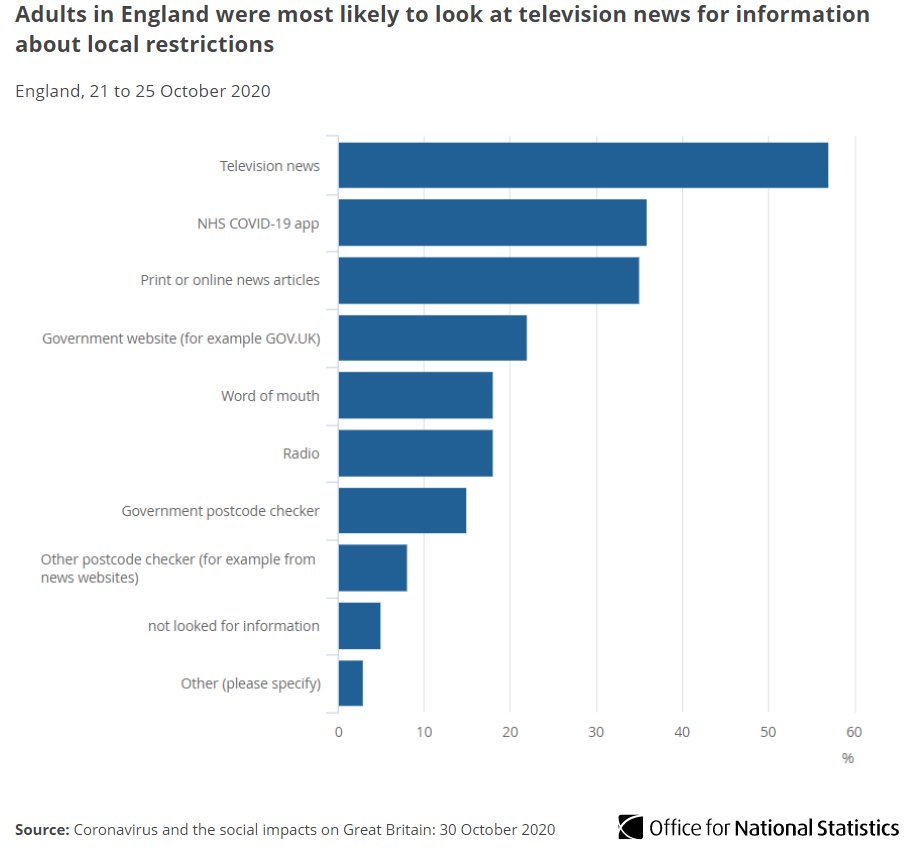
Most adults in England (78%) said it was easy or very easy to find out about alert levels in their area.

Nearly 6 in 10 (57%) said television news was their main source of information, followed by the NHS COVID app (36%) and print or online news (35%) ow.ly/zjr550C6UzJ Chart title: Adults in England were most likely to look at t
Read 7 tweets
29 Oct
Our latest economic and society impact indicators have been published today as part of our response to the #coronavirus pandemic ow.ly/zbos50C5QdA Graphic text: We've publish...
Nearly half (47%) of currently trading UK businesses reported that their turnover had decreased below what is normally expected for this time of year, according to the latest Business Impact of Coronavirus (COVID-19) Survey ow.ly/LCDR50C5Qi8
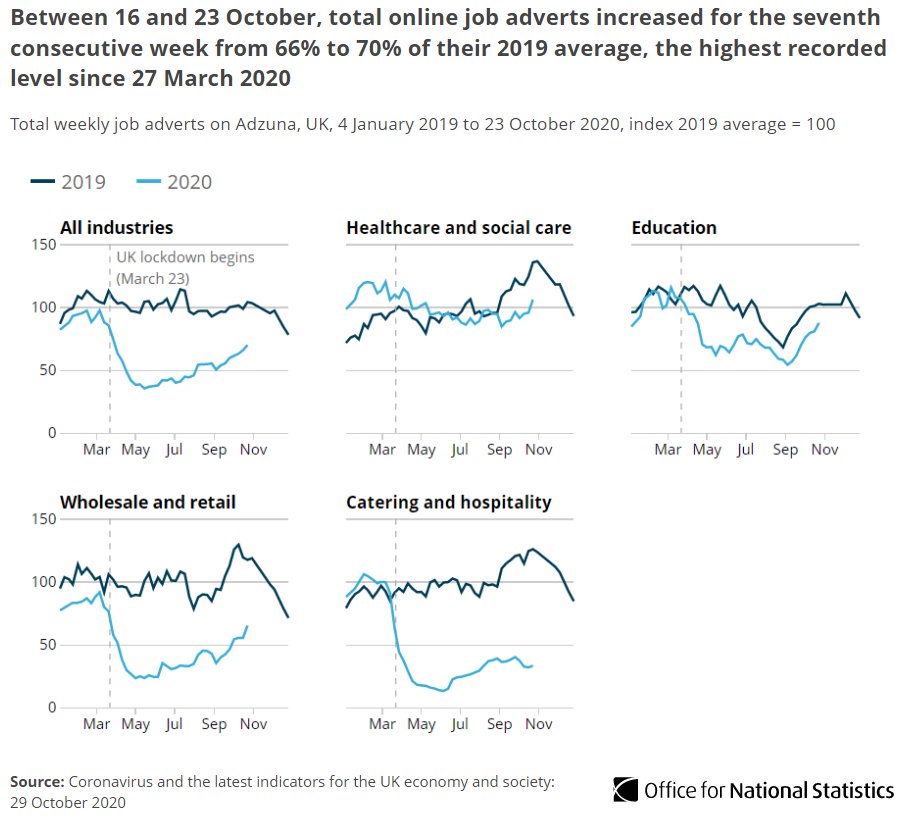
Online job adverts increased from 66% to 70% of their 2019 average between 16 and 23 October 2020 for the seventh consecutive week according to @adzuna, this is the highest recorded level since 27 March 2020 ow.ly/WiAB50C5Qkh Chart title: Between 16 and...
Read 5 tweets
27 Oct
Latest estimates show that #COVID19 infections have continued to increase in recent weeks.

We’ve provided more analysis on the characteristics and behaviours of those testing positive in England ow.ly/Vl5j50C3CN2 Graphic text: Read our latest release - Coronavirus (COVID-1
Around a third of those who tested positive for #COVID19 reported evidence of symptoms at the time of their test (from 28 September to 11 October) ow.ly/ibKu50C3DiB Chart title: A higher percentage of people who have tested p
Urban areas in England have higher positivity rates for #COVID19 than rural areas.

0.7% of the community population in urban areas tested positive, compared with 0.47% testing positive in rural areas, between 27 September and 10 October ow.ly/TRz850C3Dpe Chart title: There is a general trend of higher positivity i
Read 5 tweets
27 Oct
The provisional number of deaths registered in England and Wales in the week ending 16 October 2020 (Week 42) was 10,534.

This was

▪️ 580 more than Week 41
▪️ 669 more than the five-year average for Week 42

➡️ow.ly/5jTk50C3BLa Chart title: Deaths in England and Wales involving COVID-19
Of the 10,534 deaths registered in Week 42, 670 mention #COVID19 on the death certificate (6.4% of all deaths).

This has risen by 232 COVID-19 deaths since the previous week (Week 41) ow.ly/NjHK50C3BNg Chart title: Deaths not involving COVID-19 were similar to t
Of deaths involving #COVID19 registered up to Week 42, 34,709 deaths (63.9%) occurred in hospitals with the remainder mainly occurring in

▪️ care homes (15,819)
▪️ private homes (2,594)
▪️ hospices (767)

➡️ow.ly/W8jA50C3BRA Year-to-date deaths involving COVID-19  Year-to-date deaths
Read 9 tweets
23 Oct
As part of this week’s bulletin we are reporting estimates of how many people would test positive for #COVID19 in each of the UK’s constituent countries for the first time following the continued expansion of the survey ow.ly/G1Um50C0Dys Graphic text: Estimated percentage of people with COVID-19 (
Headline estimates for England suggest infection numbers have continued to rise in recent weeks.

At any given time between 10-16 October around 1 in 130 people not in care homes, hospitals or other institutional settings would test positive for #COVID19 ow.ly/CrIw50C0DBO Chart title: The most recent modelled estimate shows the num
During the most recent week, we estimate there were around 35,200 new #COVID19 infections per day in England ow.ly/Jx5050C0DFo Chart title: The incidence rate has continued to increase in
Read 9 tweets
23 Oct
Today is @BreastCancerNow’s #WearItPink day for breast cancer awareness.

Our most recent data show that 2019 continued the trend in reducing aged standardised mortality rates (ASMRs) of breast cancer in the female population
In England and Wales, deaths due to breast cancer accounted for 3.8% of all female deaths registered in 2019 10,081 women died from breast cancer in England and Wales in
In 2019, breast cancer was the leading cause of death for females aged 35 to 64
Read 4 tweets

Did Thread Reader help you today?

Support us! We are indie developers!


This site is made by just two indie developers on a laptop doing marketing, support and development! Read more about the story.

Become a Premium Member ($3/month or $30/year) and get exclusive features!

Become Premium

Too expensive? Make a small donation by buying us coffee ($5) or help with server cost ($10)

Donate via Paypal Become our Patreon

Thank you for your support!

Follow Us on Twitter!