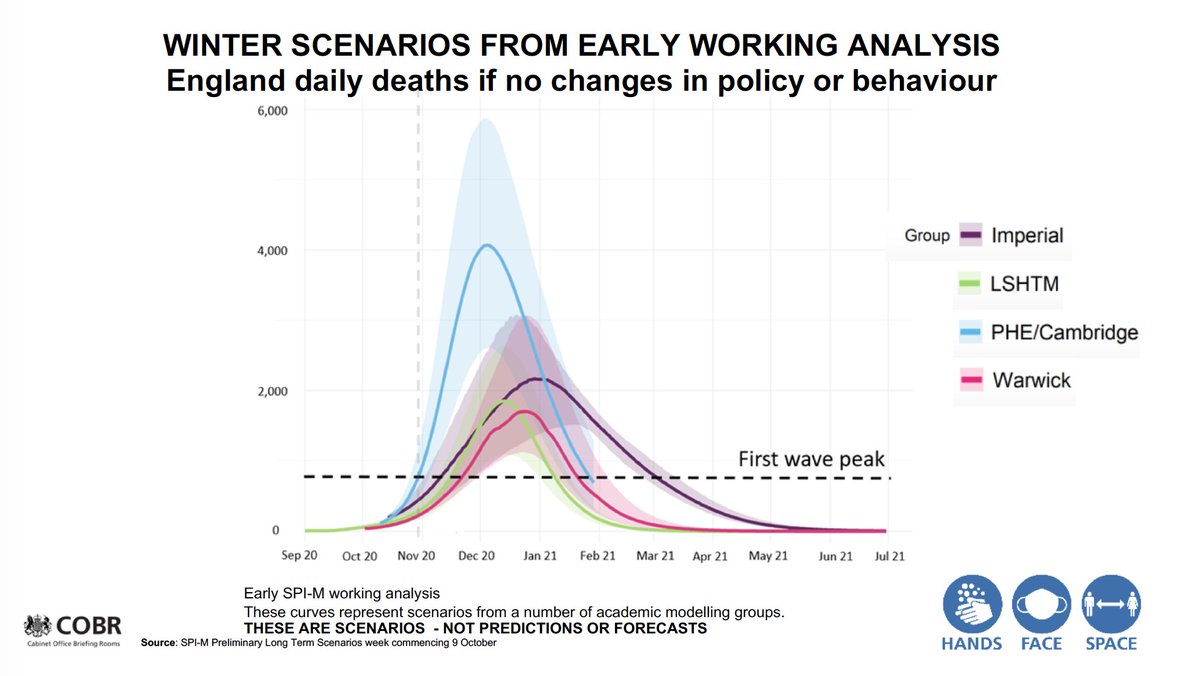
Scientific models vary according to the assumptions made. Compare here the projections for Covid19 deaths under four different epidemiological models (Imperial, LSHTM, Warwick, and Public Health England/Cambridge) and the dynamic causal model of Professor Karl Friston. (1)
Here are the four epidemiology scenario models which all show much higher daily death rates than the 'first wave' (dotted line). These informed government policy. (2)
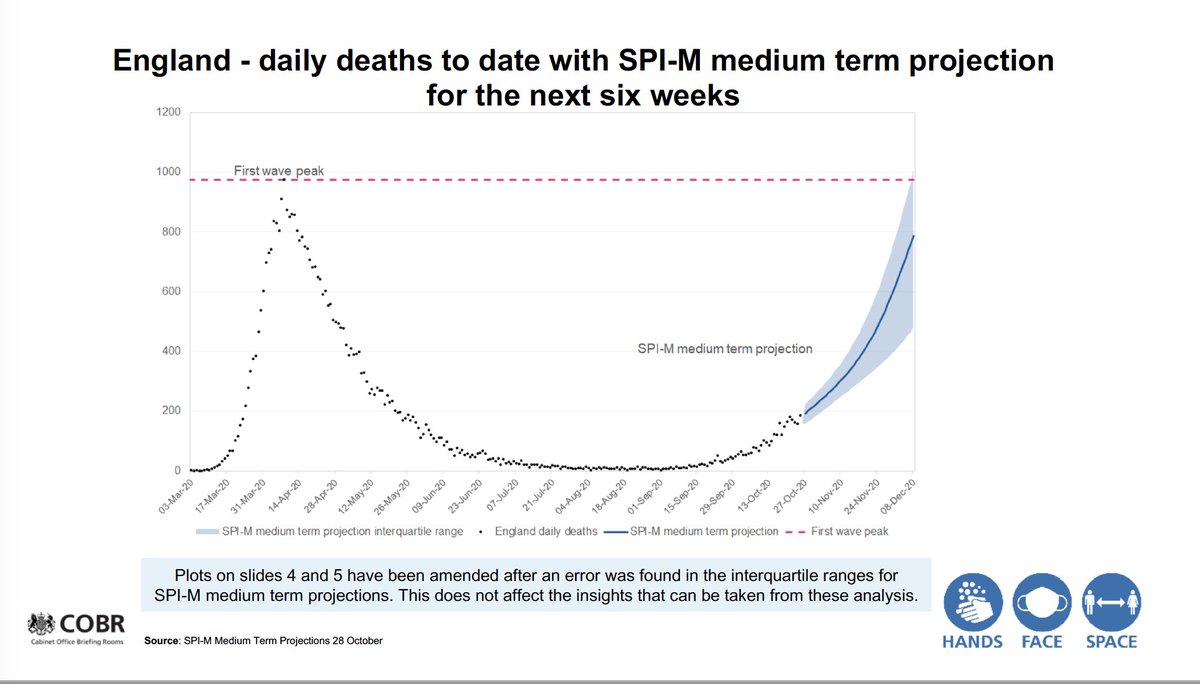
This slide shown to COBR shows the steady rise in death rates up to the first wave peak in about one month's time. (3)
These scenarios are in line with the earlier projections by the Academy of Medical Science and the LSHTM model from Davies et al, which suggested 120,000 deaths by June 2021 and 350,000 deaths by December 2021 respectively.
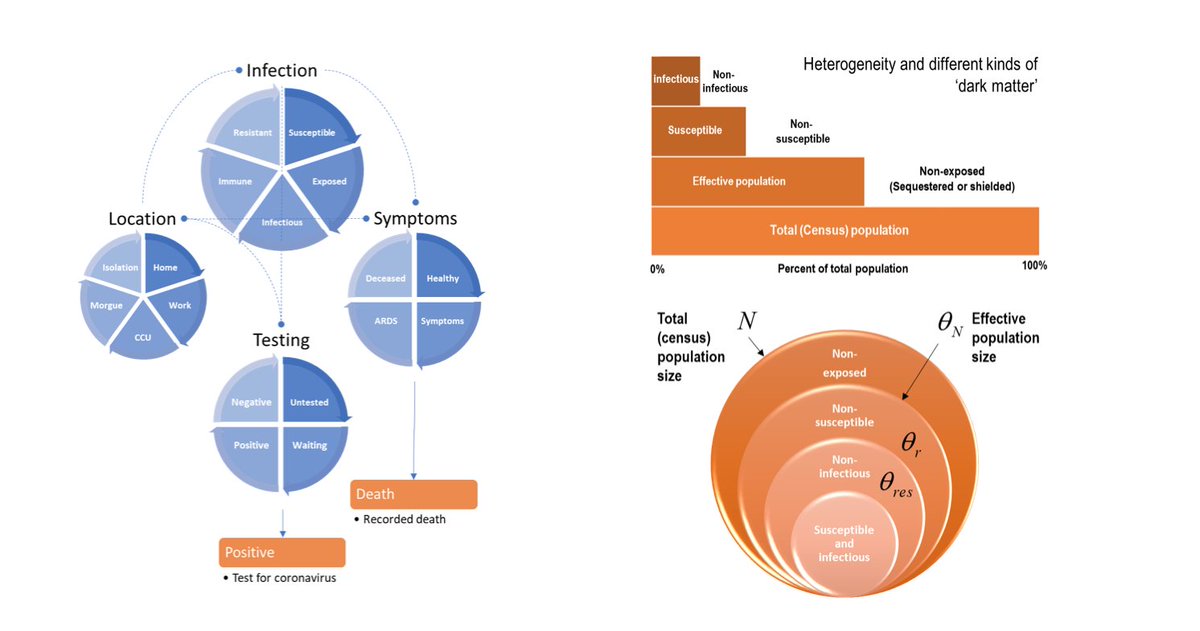
Karl Friston's dynamic causal model uses variational Bayes to estimate the unknown parameters of state-space models and then to assess the evidence for alternative models of the same data. It allows for heterogeneity in exposure, susceptibility and transmission.(4)
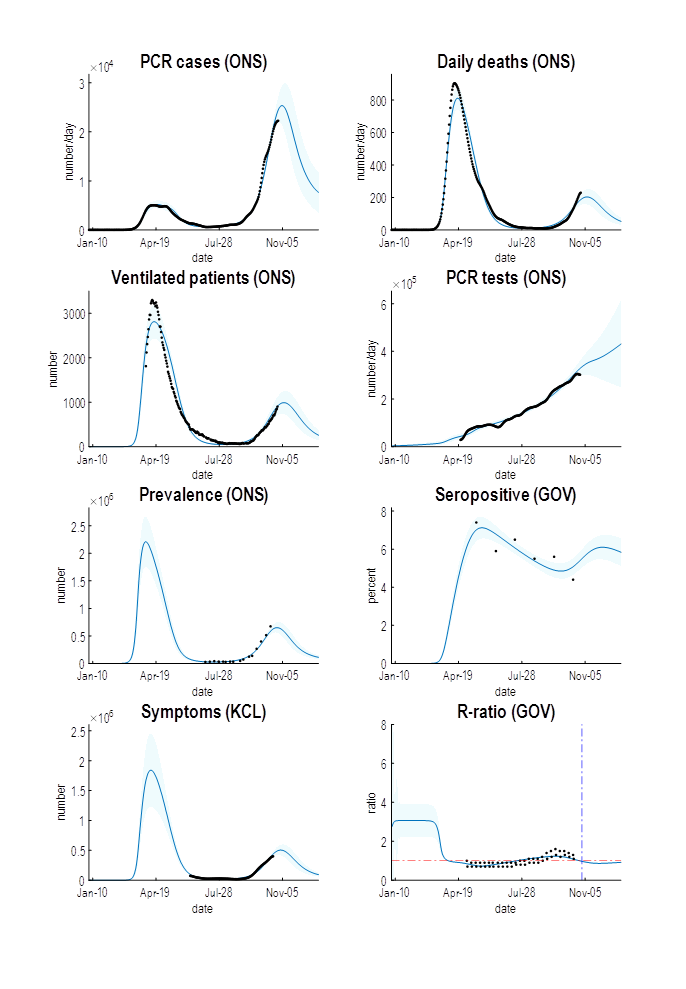
Here you see the latest run of the DCM model. Note Friston sees a peak in the death rates by next week (Nov 8)...his model shows mean death rates peaking at slightly lower than the level observed right now of a 7 day average of 300.(5)
The point is that all models are imperfect and will change as assumptions change. We can see that Friston's model is an outlier in the sense that he sees death rates peaking at a much lower rate than the SPI-M models of SAGE, and before one can attribute the peak to lockdown. (6)
Friston's model is more optimistic than the government SAGE advisers - suggesting that lockdown over four weeks can get case rates down to about 5000 per day which would allow a reformed test, trace and isolate system to keep cases under control. (7)
The government SPI-M projections suggest lockdown may need extension by weeks to maintain control.
We shall soon know which model is most accurate. This is science in progress: learning which assumptions are best to project the behaviour + impact of this complex pandemic. (8)
• • •
Missing some Tweet in this thread? You can try to
force a refresh
From the Office of Statistics regulation: In the context of the pandemic there are three things which governments should consistently do to support transparency: (1) osr.statisticsauthority.gov.uk/news/osr-state…
1. where data are used publicly, the sources of these data or the data themselves should be published alongside any press briefing and associated slides to allow people to understand their strengths and limitations (2)
2. where models are referred to publicly, particularly to inform significant policy decisions, the model outputs, methodologies and key assumptions should be published at the same time (3)
In the press conference Prof Van Tam admitted that circuit breakers work less well as cases rise. And that cases are rising in every region. That's why SAGE argued for a short 2 week circuit breaker a month ago. (1)
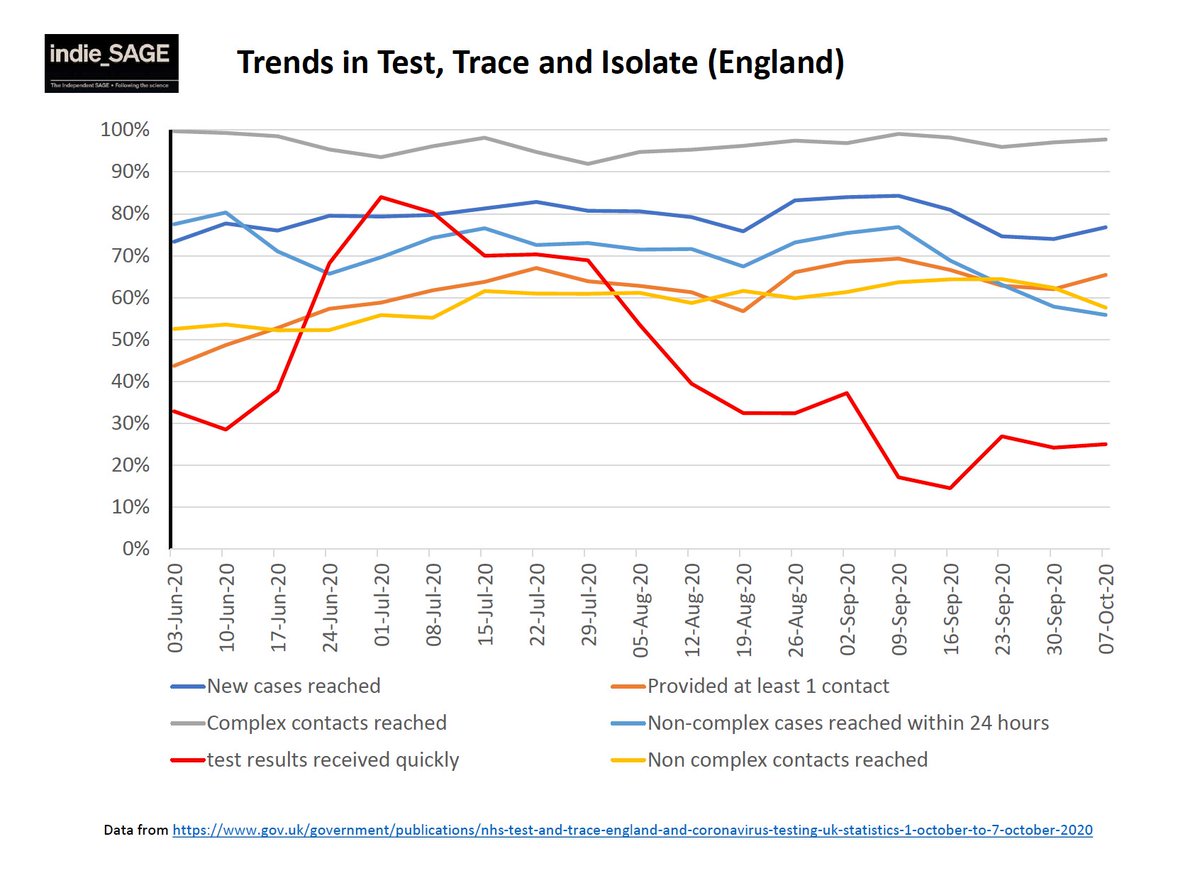
He also supported the PM arguing for both central and local contact tracing. Yet the evidence shows local contact tracing (complex below) is working at levels above 95% and call centre tracing at 55% which is dismal. Investing in local systems is far more effective. (2)
Deloitte's test results within 24 hours is down to 25%. This is hopeless. Again investment in the 44 NHS molecular virology labs which are linked to local GP NHS systems would be far more effective than the private Lighthouse labs. (3)
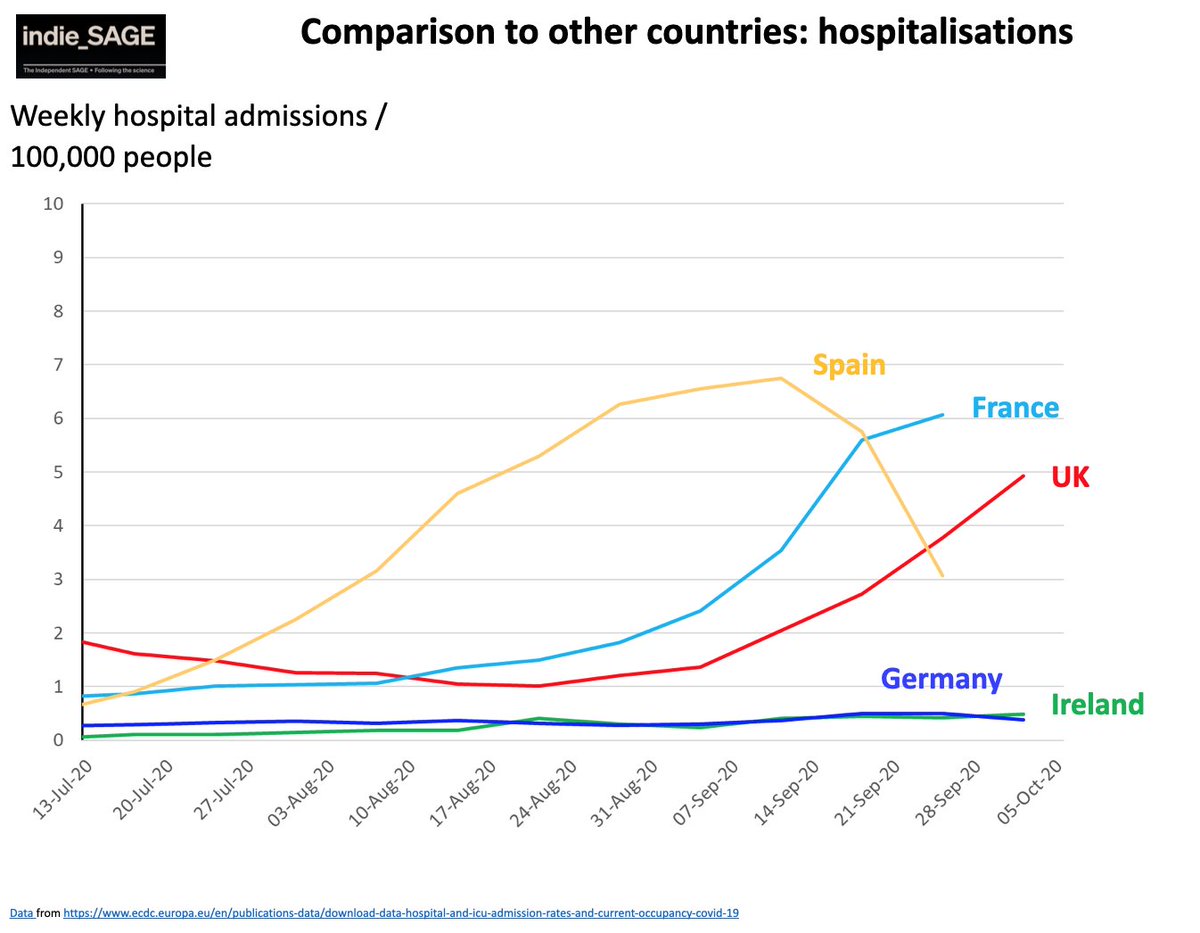
We’re in a mess. Cases, hospitalisations and deaths are all rising. It's too late for test and trace to stop it. Things will just get worse. We have FOUR options: (1)
Option 1. LOCAL LOCKDOWNS: politicians don't want a national lockdown, so local restrictions only. But RISKS are that cases and deaths rise, with possible exponential spread (as in March), even if death rates r lower than Mar/April because more vulnerable people will shield.(2)
Option 1 risks (cont): other countries will block travel to and from UK, NHS overload, indirect NHS casualties from other conditions will mount, many people off work, economy falters like last time. (3)
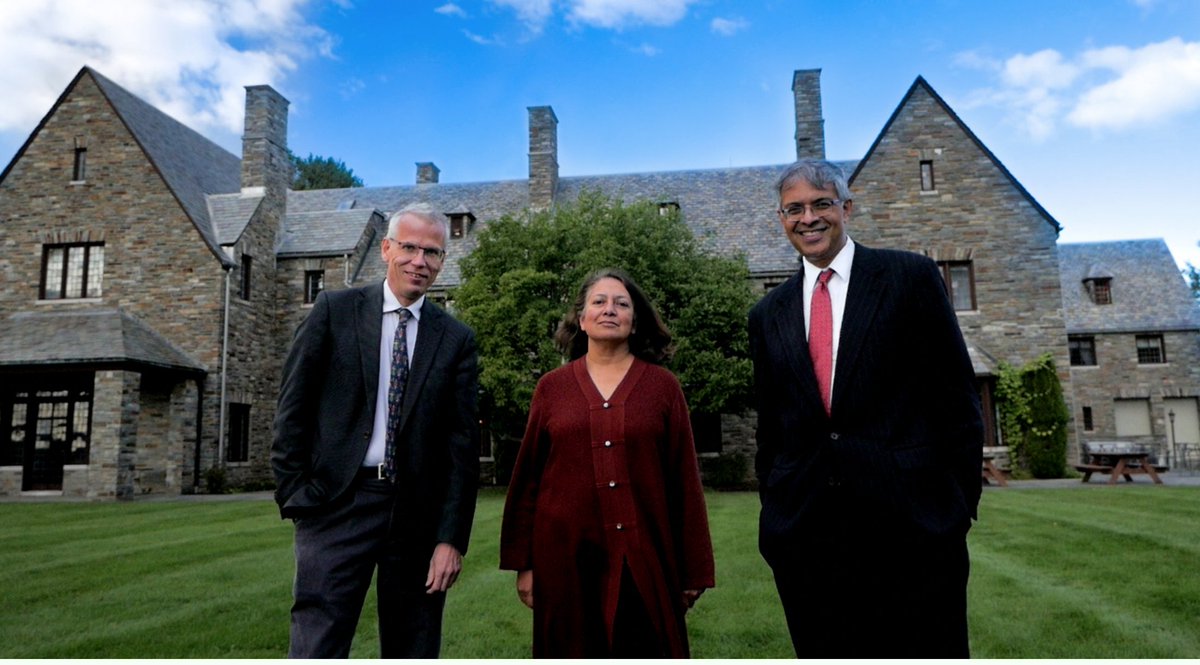
The Barrington Declaration from the quadrangles of Yale, Stanford + Oxford: "People who are more at risk may participate if they wish, while society as a whole enjoys the protection conferred upon the vulnerable by those who have built up herd immunity." (1) Er....No.
How long does immunity last?
Will herd immunity be achieved?
What about Long Covid?
Sweden tried this with 582 deaths/million, Norway 51 deaths/million didn't.
How practical is shielding 30% of the population? No data.
What are their death projections v economic benefits?
(2)
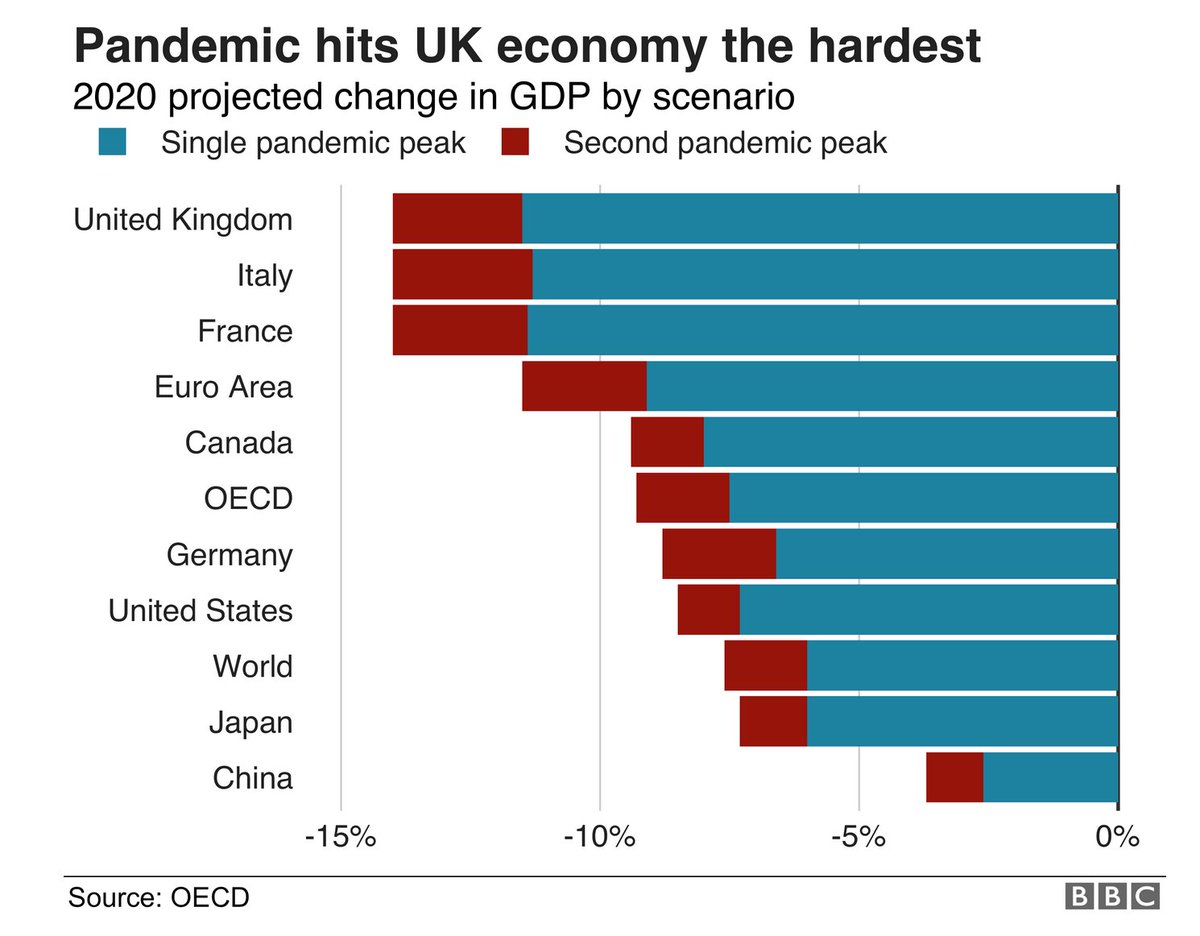
It seems odd that the countries who failed to tackle the pandemic effectively, which the Barrington people want, suffered the biggest economic hit. (3)