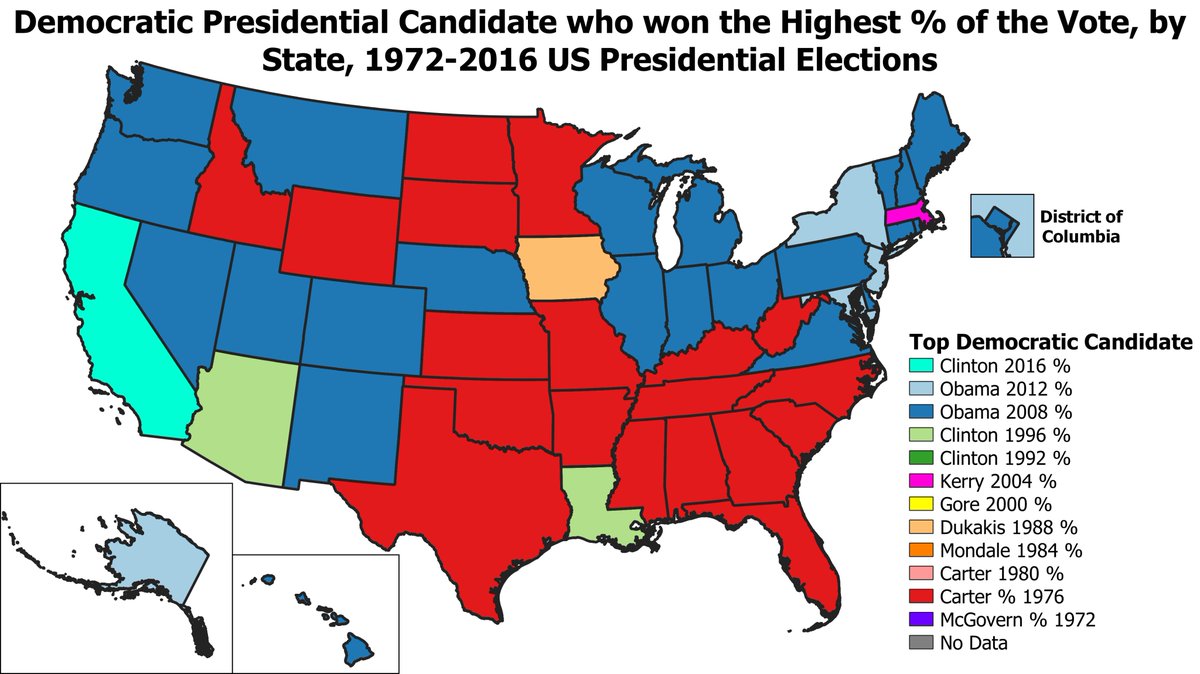
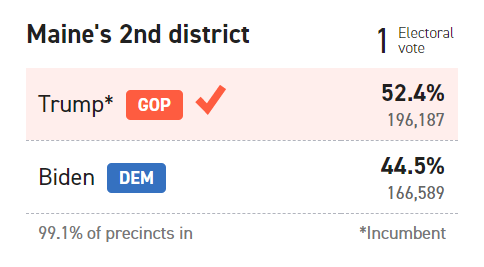
Got lost in the shuffle a bit, but Trump ended up winning the single Electoral Vote from Maine's 2nd District pretty easily, by 7.9 pts! He won it by 10.3 pts in 2016, so Biden gained 2.4 pts. Maine as a whole went from a 2.9 pt Clinton win to a 10.1 pt Biden win, a 7.2 pt swing.
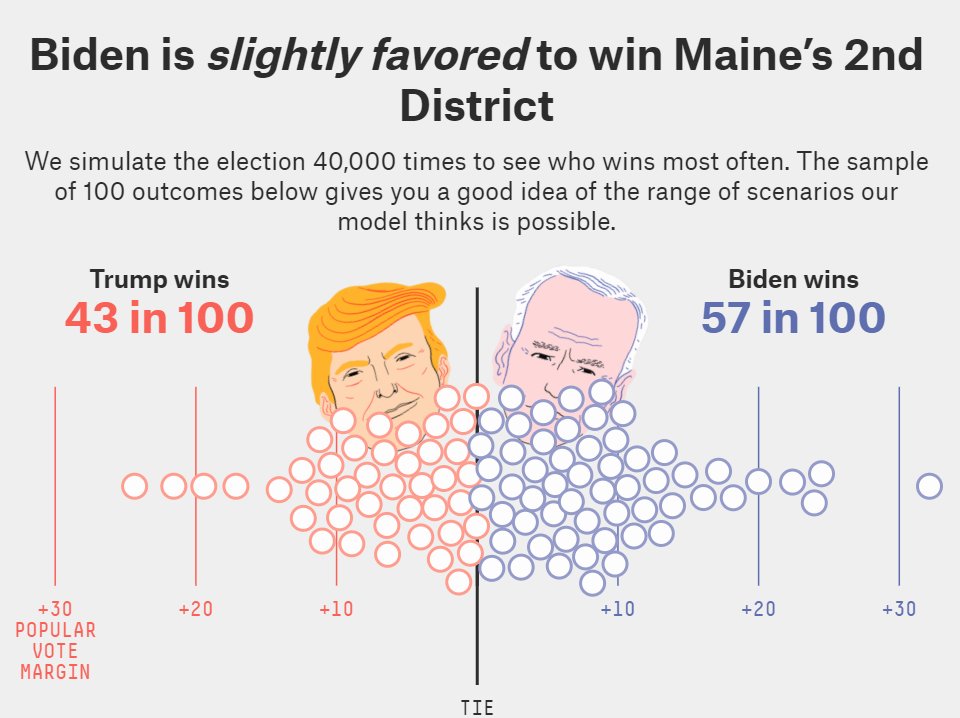
FiveThirtyEight had Biden actually favored to carry the district, with 7 of the last 8 polls favoring Biden, so this was one of the biggest misses of the cycle. Their overall Maine forecast wasn't far off though, projecting an 11.8 pt Biden win in Maine vs the actual 10.1 pt win.
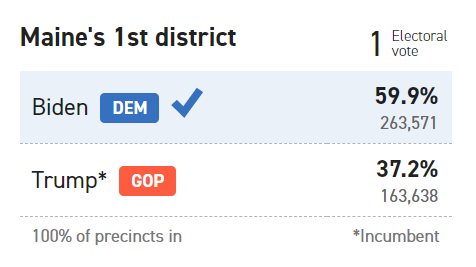
On the other hand, FiveThirtyEight actually UNDERESTIMATED Biden in the 1st District of ME, thinking he would win by only 21 pts while he is currently leading by 22.7 pts. This pattern mirrors the nation: Biden was underestimated in blue areas like CA & overestimated in red areas
2020 marks at least the 3rd straight time pollsters & 538 have over-estimated Democrats in red states while underestimating them in blue states, as it occurred in both 2012 & 2016. One more puzzle piece for figuring out what has been going wrong with polls
#ElectionTwitter Thread: Map of the county swing from the 1936 to 1940 Presidential Elections. FDR was running for an unprecedented 3rd term & did 14.3 pts worse than in 1936, with big losses in heavily German-American areas like the Midwest & Great Plains, in the run-up to WW2:
Here's the same map in Trend form, so county swings are relative to the 14 pt national swing towards the GOP. Much of the NE & South trended towards FDR. Along with German-Americans, FDR had defections from some Italian & Irish voters, contributing to losses in urban areas (NYC):
Maps of the actual 1936 & 1940 elections from Wikipedia. GOP nominee Alf Landon had been blown out by FDR in 1936, only winning a smattering of counties across the country, but Wendell Wilkie was much more competitive in 1940, winning wide swathes of the rural heartland of the US
I'm assuming this is a reference to beautiful Supai, on the Havasupai Reservation, AZ. Supai is 8 miles from the nearest road, only accessible by foot, helicopter, or mule. I had never considered the concept of mule-in ballots from there tho:
Supai is located in Cataract Canyon, the largest side-canyon of the Grand Canyon. Havasu creek runs through the canyon on the way to the Colorado River, it is aquamarine in color due to the presence of calcium carbonate in the travertine deposits that line the creek.
Supai AZ has been referred to as "the most remote community" in the contiguous United States by the U.S. Department of Agriculture. Here is a mule train from Supai carrying US Postal Service boxes, I assume this is how ballots would be mailed to & returned from the voters there:
#ElectionTwitter Map of which Democratic Presidential Candidate got the highest % of the vote in each county, from 1972-2016. Carter's run in 1976 (colored red) achieved the highest Democratic % in the most counties, 2,010 in total, many in areas that are very conservative today.
If we focus on the modern Dem coalition by taking out Carter's runs, most counties highest Dem % comes from one of: Obama's run in 2008 (which did well in more liberal areas), Clinton's runs in 1992/1996 (strong in the South), & Dukakis' run in 1988 (areas hit by the Farm Crisis)
Here's the best performing Democratic Presidential Candidate by State from 1972-2016. Carter's run in 1976 & Obama's 2008/2012 runs achieved the highest Democratic % in the most states, except for: CA (Clinton 2016), MA (Kerry 2004), AZ/LA (Clinton 1996), & IA (Dukakis 1988).