ISM Manufacturing New Orders rose to 67.9 in October, their highest lvl since Jan ‘04.
While quite a few US macro indicators continue to track an ‘01 analog (NFIB, consumer conf., heavy truck sales, etc.), it’s interesting to see how closely ISM NOs are mirroring the early 80’s.
While quite a few US macro indicators continue to track an ‘01 analog (NFIB, consumer conf., heavy truck sales, etc.), it’s interesting to see how closely ISM NOs are mirroring the early 80’s.
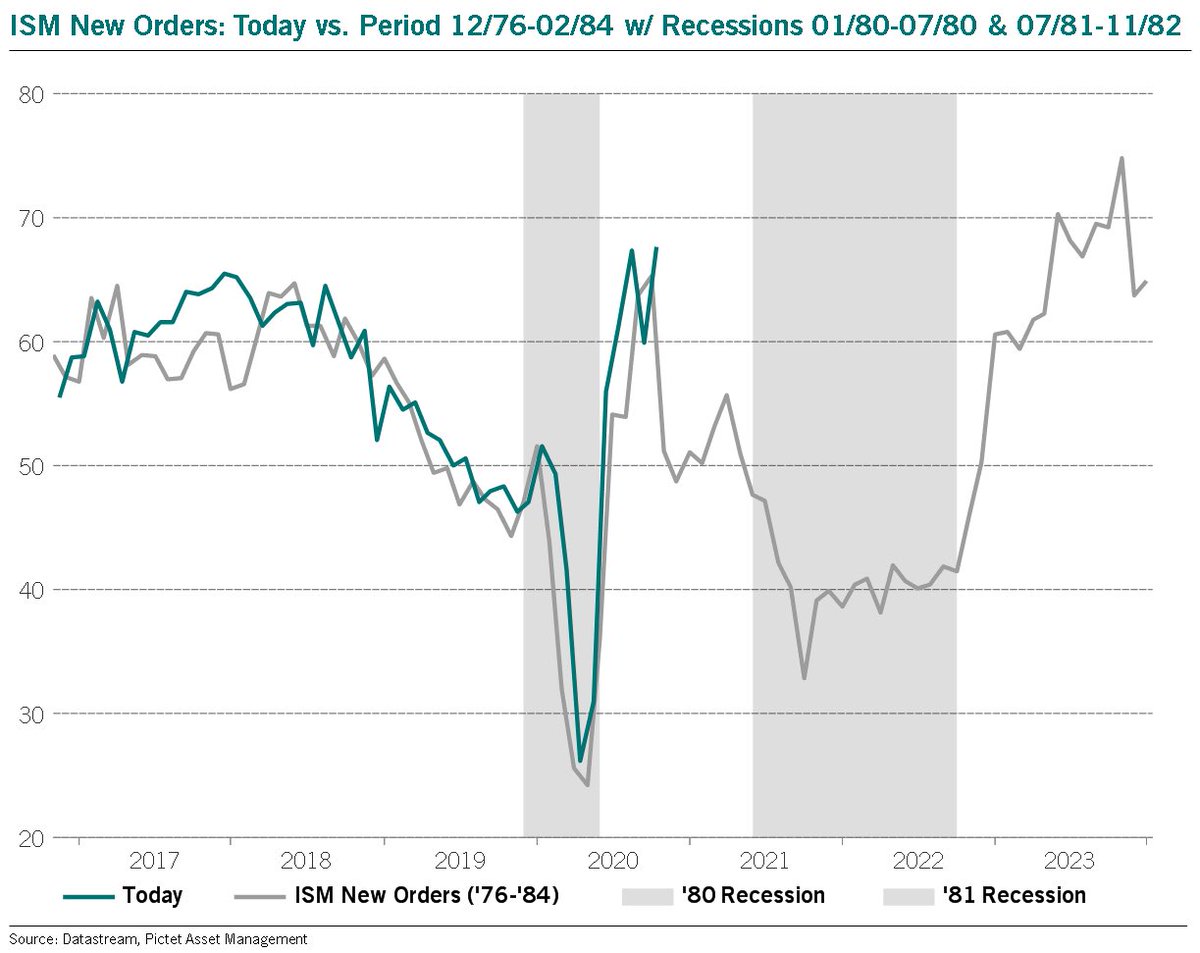
Even the magnitude of the move is identical: a 40pt rise over 6M.
Back then, this marked the peak & what followed was a 12M decline in new orders from Nov ‘80-Nov ‘81.
Equities officially bottomed in Aug ‘82, which was the true cycle low & an 8Y bull mkt in equities started.
Back then, this marked the peak & what followed was a 12M decline in new orders from Nov ‘80-Nov ‘81.
Equities officially bottomed in Aug ‘82, which was the true cycle low & an 8Y bull mkt in equities started.

Additionally, the only other period in the last 50Y where we had a similar bounce in economic activity with my US macro composite still in the 50th percentile, was the early 80’s.
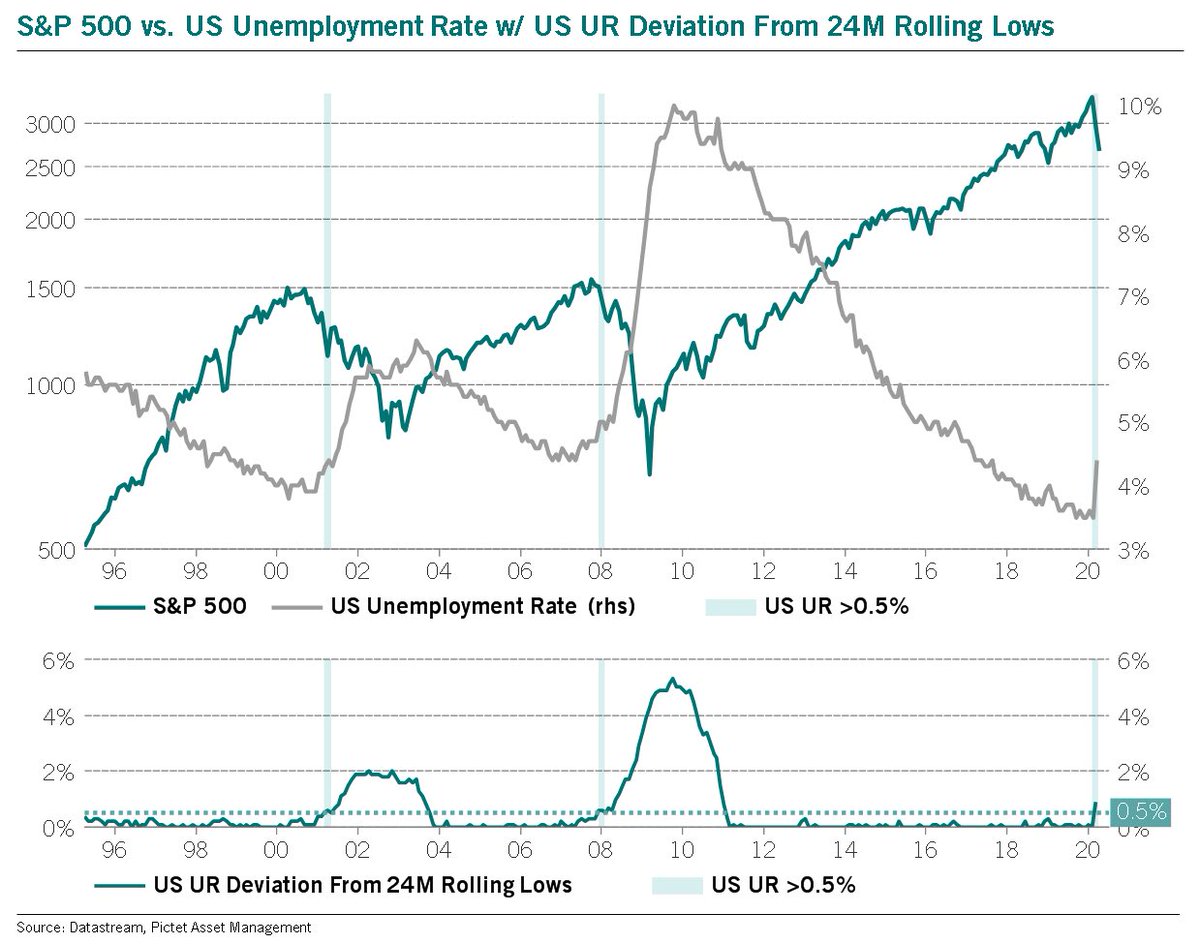
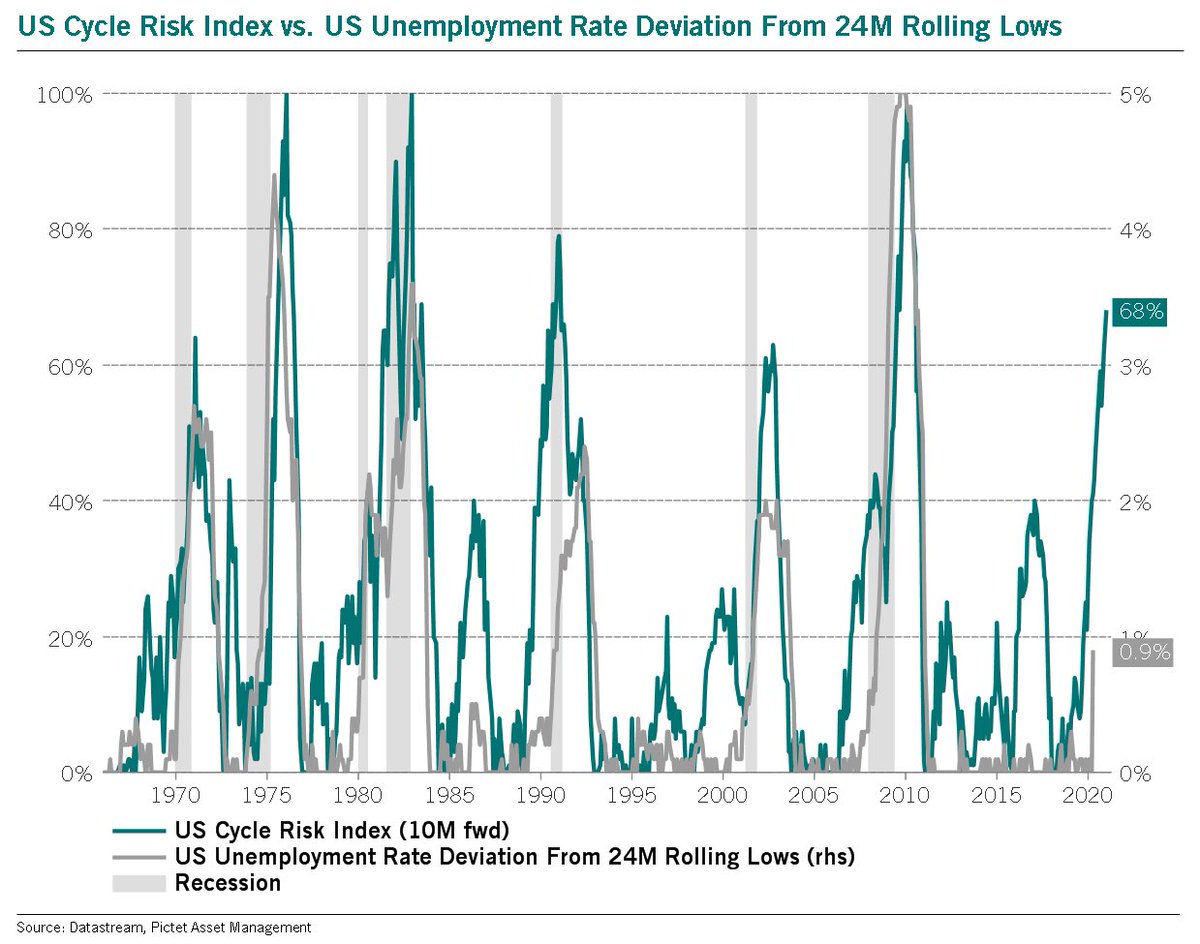
Bull markets with legs usually occur with a cross <20%. Think of this as a macro valuation score.
Bull markets with legs usually occur with a cross <20%. Think of this as a macro valuation score.

The S&P 500 is also tracking this period very closely.
Back then, following an initial 17% drop in the S&P 500, equities rallied hard for 8M completely blind to what was coming next, a double-dip recession.
There’s a lot of moving parts, but this remains my base case for now.
Back then, following an initial 17% drop in the S&P 500, equities rallied hard for 8M completely blind to what was coming next, a double-dip recession.
There’s a lot of moving parts, but this remains my base case for now.

Interestingly, the early 80’s peak in the S&P 500 also took place in an election year & just weeks following Reagan’s win over Carter.
Equities went vertical on the news, rising 11% in 4W before peaking on Nov 28th, then trending lower for half of Reagan’s first term in office.
Equities went vertical on the news, rising 11% in 4W before peaking on Nov 28th, then trending lower for half of Reagan’s first term in office.

Let’s also not forget that US bank lending standards for commercial & industrial loans are as tight as they were during the global financial crisis in 2008.
This would continue to suggest that a significant slowdown in C&I loan growth is ahead.
This would continue to suggest that a significant slowdown in C&I loan growth is ahead.

And the tightening in US lending standards means charge-off rates for C&I loans should approach 2.5% by Q3 ‘21 for the 100 largest banks.

Here are the last 4X the percentage of US banks reporting a tightening in lending standards for C&I loans was greater than 50%, while charge-off rates for C&I loans were still below 1% given the 4Q lead.

And this coming at a time when US corporate debt as a percentage of GDP is at its highest level in history.

Bank willingness to make consumer installment loans has also fallen to the lowest levels since GFC.

And look at credit card lending conditions - the tightest on record.

Here is credit card lending YoY, down 10%. Still one-way traffic.

Additionally, as I highlighted last week, stock market breadth is very weak with just 32% of MSCI World stocks beating the index YoY.
This is exactly the same level as May ‘99 & Mar ‘08.
This is exactly the same level as May ‘99 & Mar ‘08.

Add to this: record equity valuations & risk-averse market conditions...

Meanwhile, positioning is very one-sided across the board.
Hedge funds are nearing a record long 10Y vs. 30Y UST position.
Hedge funds are nearing a record long 10Y vs. 30Y UST position.

Same story looking at the S&P 500 vs. US 30Y bonds.
Here I’ve included another measure of valuation: US market cap to GDP.
The last time positioning was this stretched, equity valuations were 70% lower than current levels.
Here I’ve included another measure of valuation: US market cap to GDP.
The last time positioning was this stretched, equity valuations were 70% lower than current levels.

The extreme positioning is mostly being driven by the record 30Y UST short as a % of open interest.

Speculative positioning in commodities is still near record highs too.

US dollar shorts have capitulated after being near record short.
The last 6X this happened, the dollar moved higher.
The last 6X this happened, the dollar moved higher.

And VIX is just coming off one of its largest shorts in history...
The bottom line is that everyone is positioned for reflation.
The bottom line is that everyone is positioned for reflation.

Here’s one possible way this whole thing plays out for equities & this was my line of thinking heading into election wk.
Support held w/ equities up 7% last week, but this could be forming a rising wedge & not a bullish pennant like everyone thinks.
The RSI divergence is huge.
Support held w/ equities up 7% last week, but this could be forming a rising wedge & not a bullish pennant like everyone thinks.
The RSI divergence is huge.

And I’m also still in the camp that 30Y yields will fall to zero or lower.

Notice here I don’t discuss the outcome of the election or the risk of a second lockdown.
These are clearly very important topics but I think there’s a much bigger macro theme playing out.
Next year will be very interesting.
These are clearly very important topics but I think there’s a much bigger macro theme playing out.
Next year will be very interesting.
As always, it’s very important to keep an open mind in this complex market environment, but I thought this was worth sharing. Stay safe.
• • •
Missing some Tweet in this thread? You can try to
force a refresh