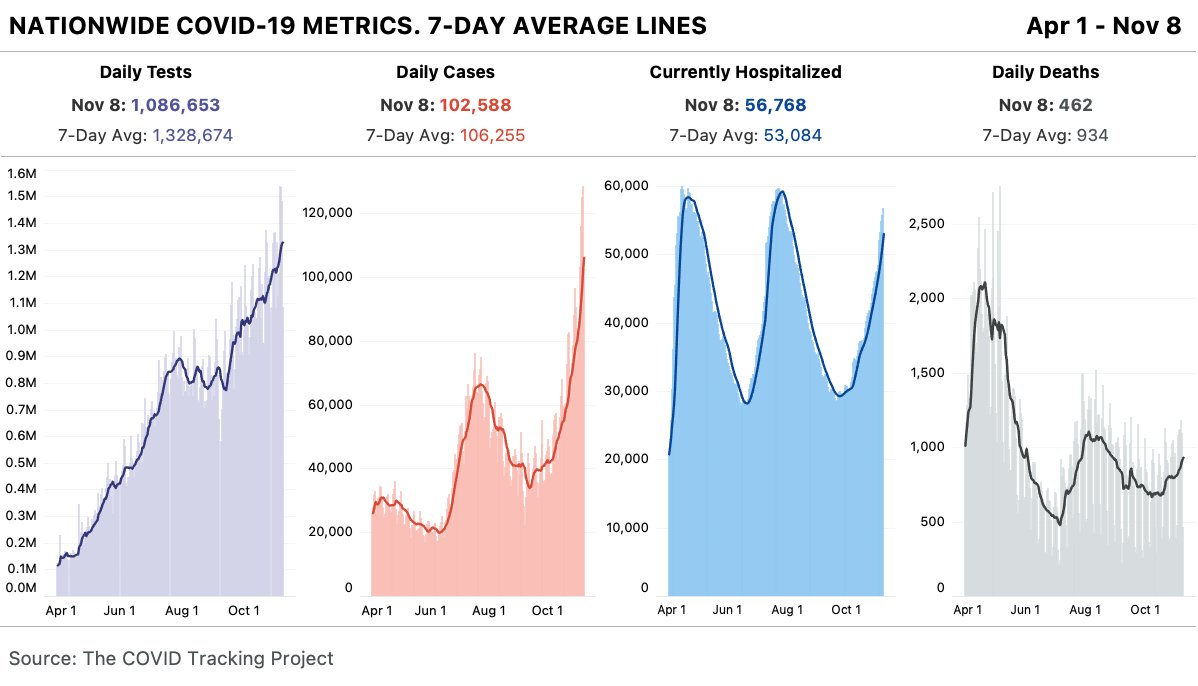
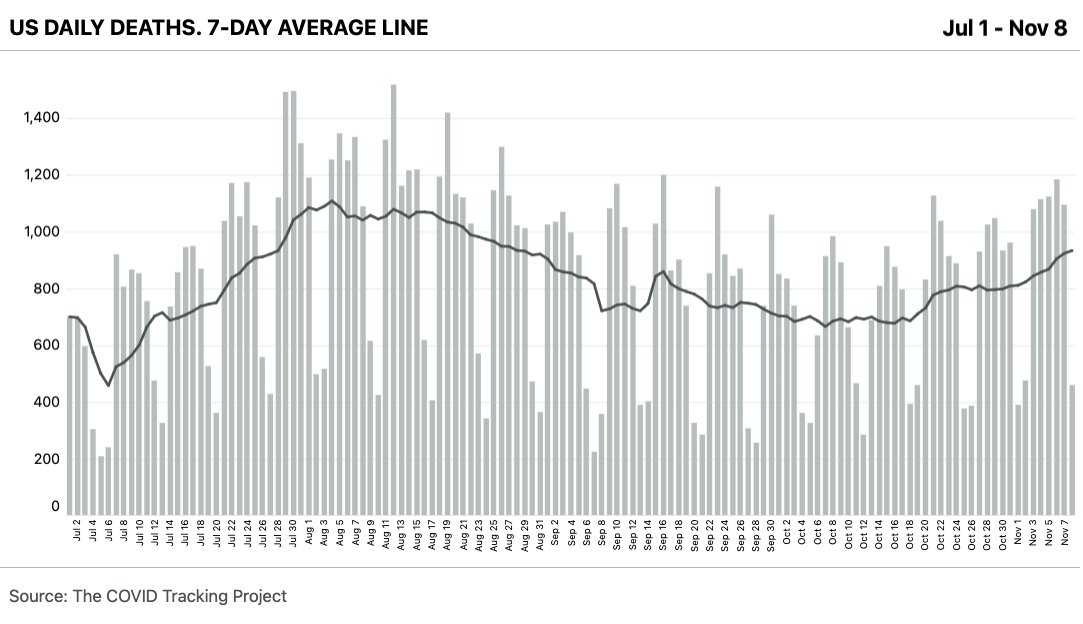
Our daily update is published. States reported 1.5 million tests, 119k cases, and 59k people currently hospitalized with COVID-19. The death toll was 580. 4 bar charts showing key US...
Today's hospitalization number marks the largest single-day increase since July 10, and the highest total number since July 25. Bar chart showing currently...
South Dakota's hospitalization rates are the highest in the country. There are 640 currently hospitalized per million people in the state. Chart showing lines represe...
Illinois has reported over 10k daily cases for 4 consecutive days. Cartogram map showing new c...
The nationwide 7-day average for cases is now over 100k. Line chart showing US daily...

• • •

Missing some Tweet in this thread? You can try to force a refresh
 

Keep Current with The COVID Tracking Project

The COVID Tracking Project Profile picture

Stay in touch and get notified when new unrolls are available from this author!

Read all threads

This Thread may be Removed Anytime!

PDF

Twitter may remove this content at anytime! Save it as PDF for later use!

Try unrolling a thread yourself!

how to unroll video
  1. Follow @ThreadReaderApp to mention us!

  2. From a Twitter thread mention us with a keyword "unroll"
@threadreaderapp unroll

Practice here first or read more on our help page!

More from @COVID19Tracking

12 Nov
Our daily update is published. States reported 1.4M new tests and 144k cases, another all-time high. 65.4k people are hospitalized, 15k more than on election day. The death toll was 1,421, pushing the 7-day average over 1,000. 4 bar charts showing key CO...
On a per capita basis, more people are now dying across the Midwest than even at the peak of the summer surge in the South. 4 bar charts showing region...
Deaths are up substantially in every state in the Midwest region—and we're now seeing more fatalities from the most populous states. A series of charts showing ...
Read 5 tweets
11 Nov
The third wave of COVID-19 deaths in long-term care facilities is here. Since May, we have compiled all the data states provide on cases and deaths within these facilities, where a shocking 40% of the nation’s COVID-19 deaths have originated - that’s 91,596 deaths. 3 bar charts showing weekly...
In October, 8.4% of long-term care facility residents diagnosed with COVID-19 died. The rising cases of the past few weeks are resulting in the highest number of deaths in months as states and facilities fail to protect these most vulnerable Americans. Map of the US showing new d...
South Dakota’s long-term care data last week painted a dire picture as 73% of deaths that occurred in the state were among long-term care residents. covidtracking.com/data/state/sou…
Read 6 tweets
11 Nov
Our daily update is published. States reported 1.2 million tests and 131k cases, the highest single-day total since the pandemic started. There are 62k people currently hospitalized with COVID-19. The death toll was 1,347. Nationwide COVID-19 metrics...
Today’s number of currently hospitalized people—62k—is also a record. A total of 17 states have reported single-day record hospitalizations. Map showing states that rep...
Deaths are also rising. Today’s death count is the highest since August 19, pushing the 7-day average up to nearly 1,000. Bar chart showing US daily ...
Read 5 tweets
9 Nov
Our daily update is published. States reported 1.1 million tests, 103k cases, and 57k people currently hospitalized with COVID-19. The death toll was 462. Chart showing tests, cases, current hospitalizations, and de
This is the largest number of cases ever reported on a Sunday—more than 25k more than last week—despite California not reporting by the time we published this data.
The 7-day average of deaths reported by states is now up 36% in the last 3 weeks. Here's a chart of deaths since July 1. US daily deaths reported by states, with the seven-day avera
Read 5 tweets
8 Nov
Our daily update is published. States reported 1.5 million tests and 128k cases, making today the fourth day in a row the US broke its case count record. There are 56k people currently hospitalized with COVID-19. The death toll was 1,097. 4 bar charts showing key COVID-19 metrics for the US over ti
A total of 715k cases were reported last week. This means that 1 in every 462 people in the US tested positive for COVID-19 last week. Hosp. are also spiking in all regions, and are now close to the totals we saw in the spring and summer surges. 4 bar charts showing key COVID-19 metrics for the US over ti
Illinois reported an all-time high case count today—12k. Cases in the midwestern state have doubled in the past two weeks, pushing the per-capita case total to nearly 1,000. 4 bar charts showing key COVID-19 metrics in Illinois over t
Read 5 tweets
7 Nov
Our daily update is published. States reported 1.5 million tests and a record 126k cases. There are 55k people currently hospitalized with COVID-19. The death toll was 1,186. 4 bar charts showing key COVID-19 metrics for the US over ti
Daily tests continue to rise, but it’s unclear how many are antigen tests. As we noted in our weekly update yesterday, @HarvardGH estimates a need for ~14 million daily tests. US daily tests have yet to exceed 1.5 million.
Deaths are increasing across the US, particularly in the Midwest. Today's national total is the highest since Sept 16. The 7-day average for deaths is the highest since Aug 31.
Read 5 tweets

Did Thread Reader help you today?

Support us! We are indie developers!


This site is made by just two indie developers on a laptop doing marketing, support and development! Read more about the story.

Become a Premium Member ($3/month or $30/year) and get exclusive features!

Become Premium

Too expensive? Make a small donation by buying us coffee ($5) or help with server cost ($10)

Donate via Paypal Become our Patreon

Thank you for your support!

Follow Us on Twitter!