
Yes, digging into the new Nature hurricane paper. 🌀
Some interesting findings for sure!
Some interesting findings for sure!
The data is freely available in a handy Excel spreadsheet so the first thing to do is plot it up!
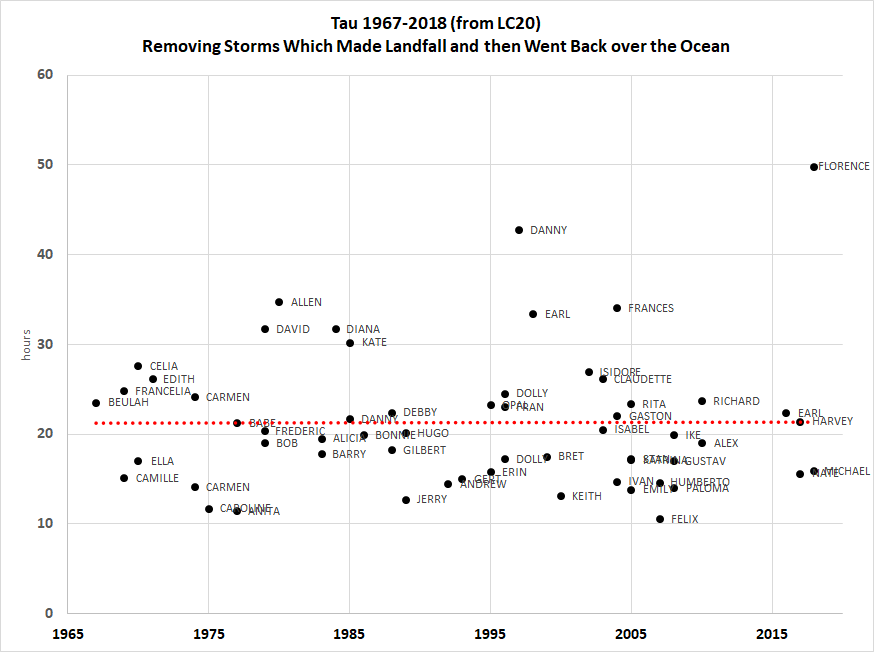
The authors (LC20) state inland hurricane decay has slowed over time -- and dramatically so.
Thus, we see from the 'tau' parameter (hours) the clear upward trend🧐
The authors (LC20) state inland hurricane decay has slowed over time -- and dramatically so.
Thus, we see from the 'tau' parameter (hours) the clear upward trend🧐
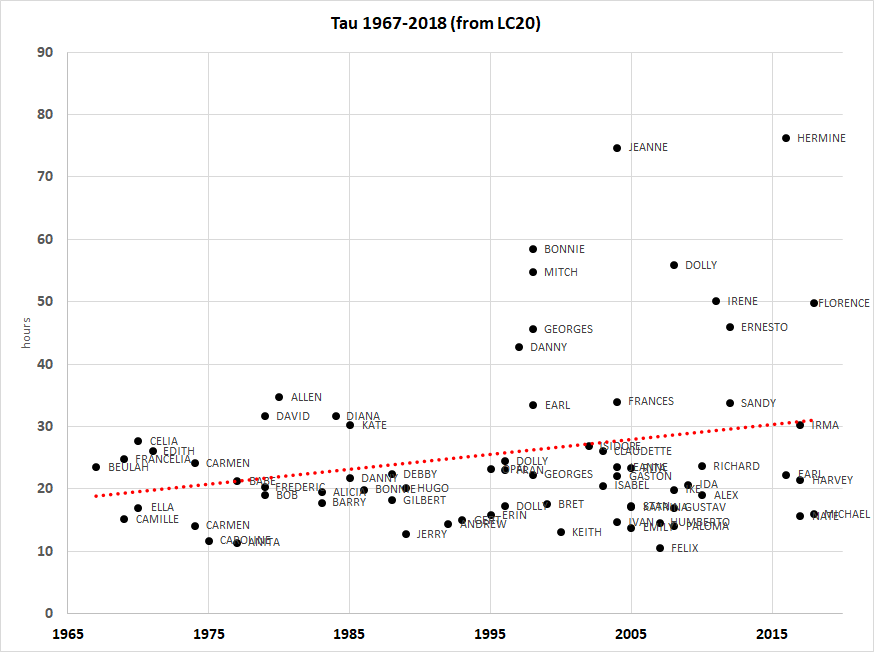
Pretty clear that Bonnie and Mitch (1998), Jeanne (2004), Dolly (2008), Irene (2012), Hermine (2016) and Florence (2018) all have extreme values of tau or slow decays. This is attributed to climate change (oceanic sea-surface temperature increases).
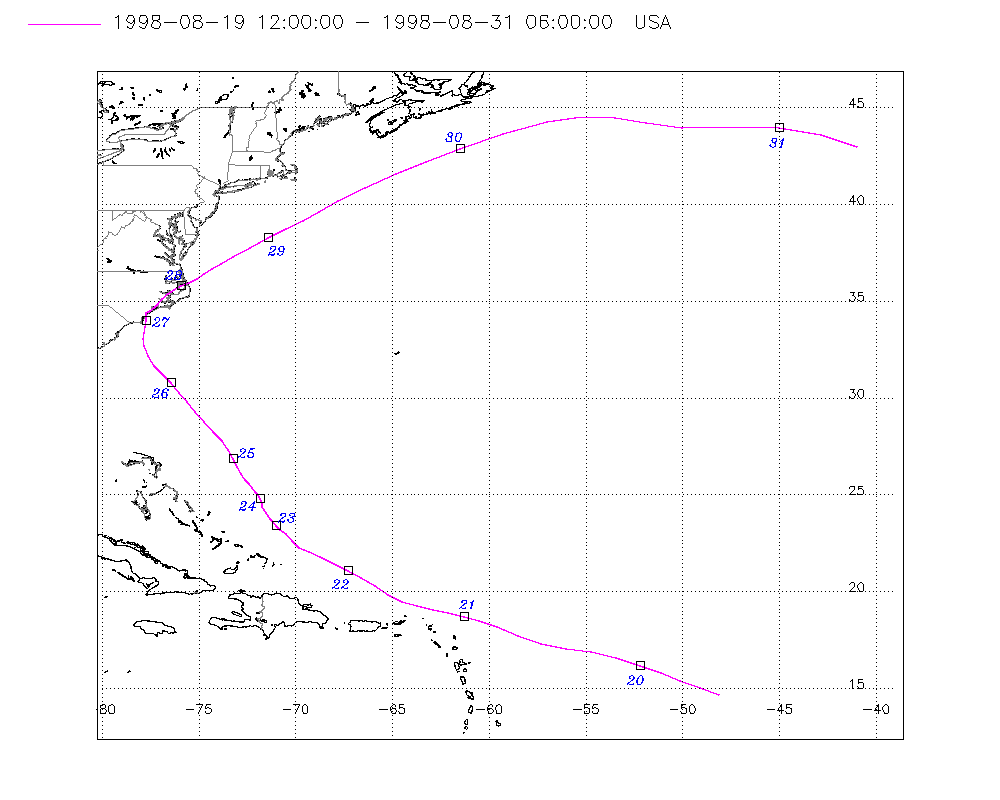
So, let's first take a look at Bonnie (1998). How does this fit into the overall narrative?
Bonnie makes landfall along the North Carolina coast and outer banks. This is not a typical example of inland hurricane decay at all.
Bonnie makes landfall along the North Carolina coast and outer banks. This is not a typical example of inland hurricane decay at all.
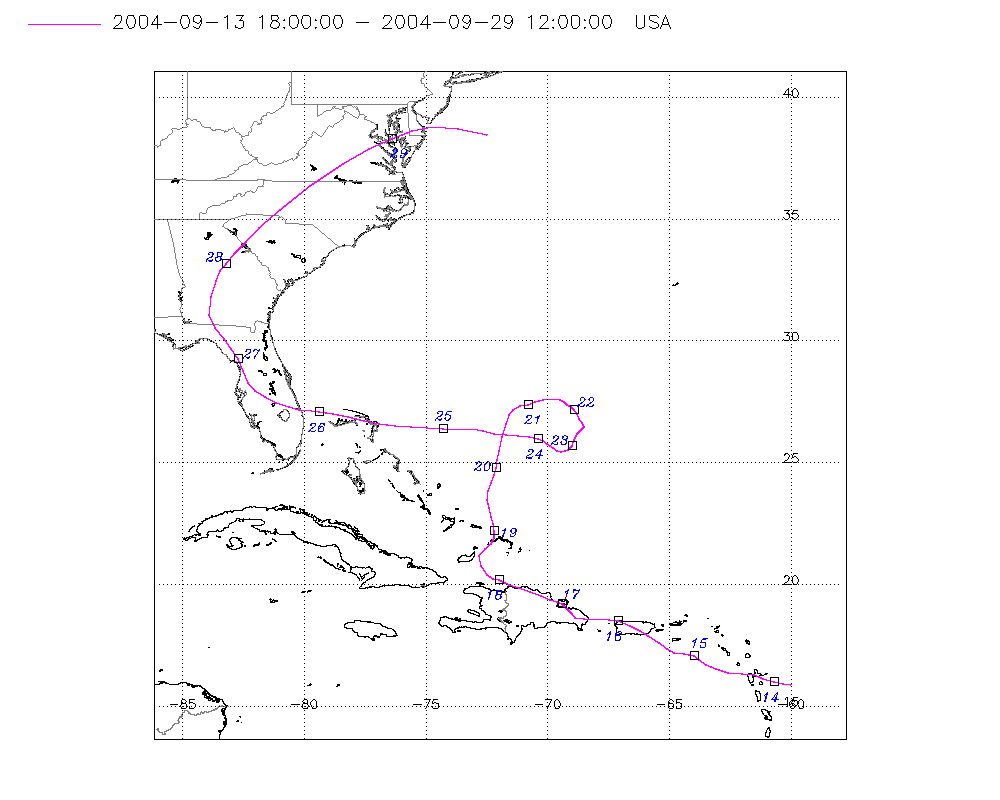
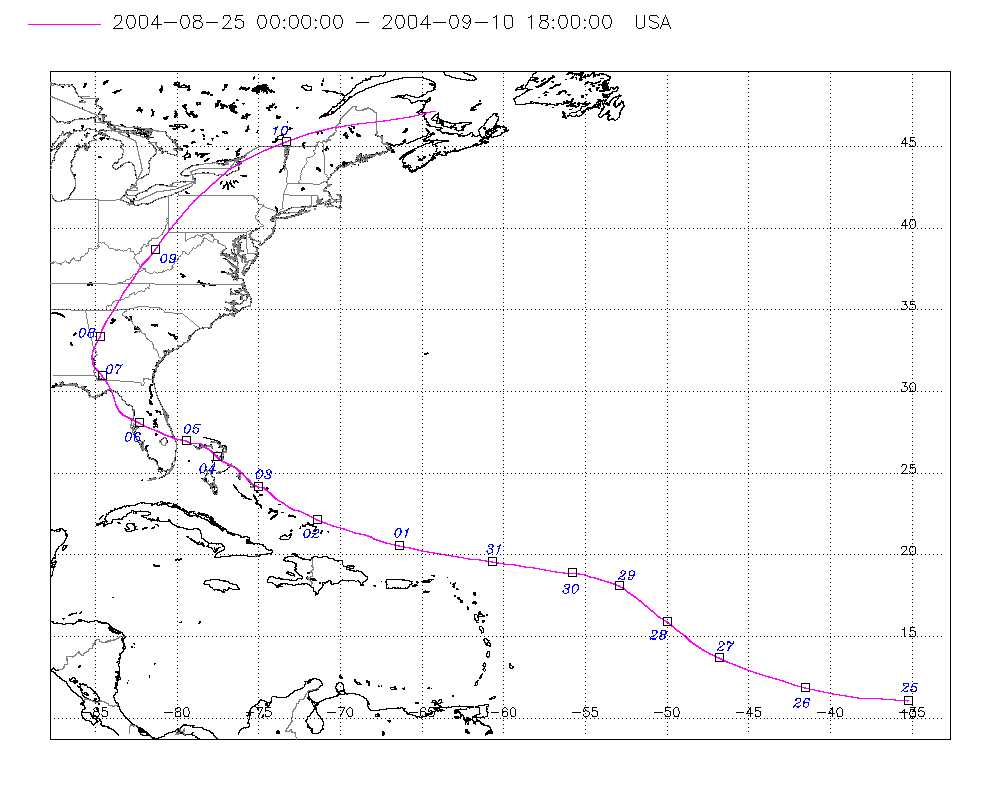
Hurricane Jeanne (2004) appears in LC20 dataset twice due to 2 landfalls: Hispaniola and Florida.
The extreme value of tau is associated w/grazing of Dominican Republic. This is also not a typical example of inland hurricane decay as much of storm circulation remains over water.
The extreme value of tau is associated w/grazing of Dominican Republic. This is also not a typical example of inland hurricane decay as much of storm circulation remains over water.
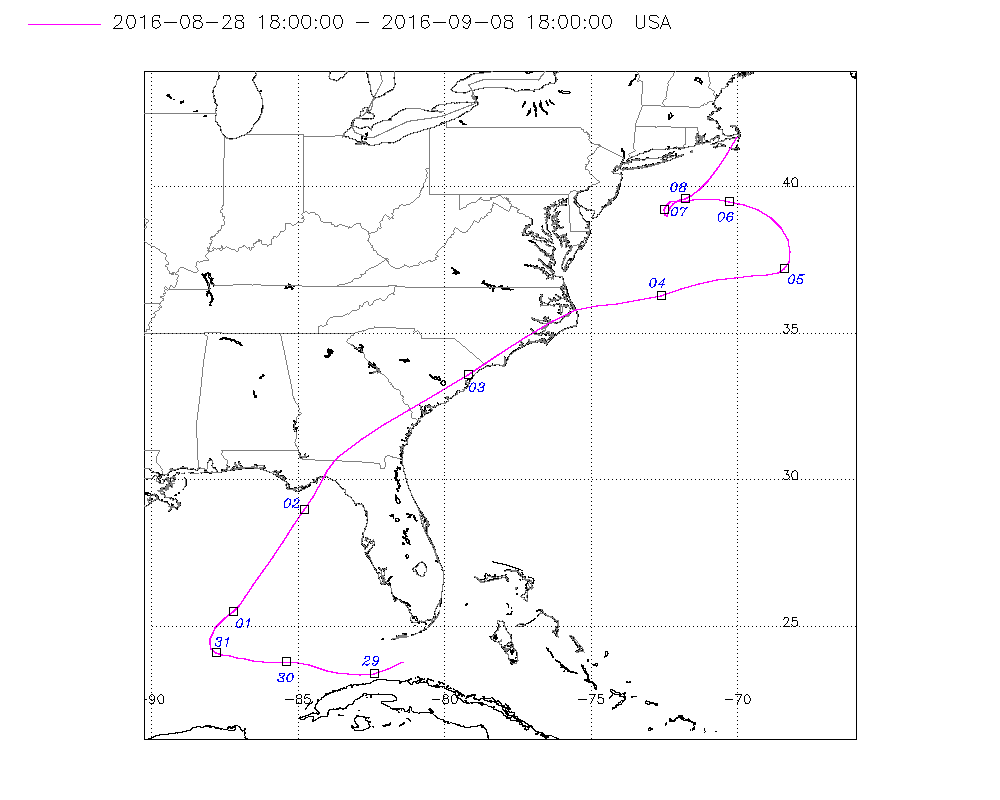
Hurricane Hermine (2016) reached 70-knots (Cat 1) prior to landfall and then only reduced to 50-knots as it raced NE & became a strong post-tropical storm (extratropical transition) off the Carolina outer banks.
This is also not a typical example of inland hurricane decay.
This is also not a typical example of inland hurricane decay.
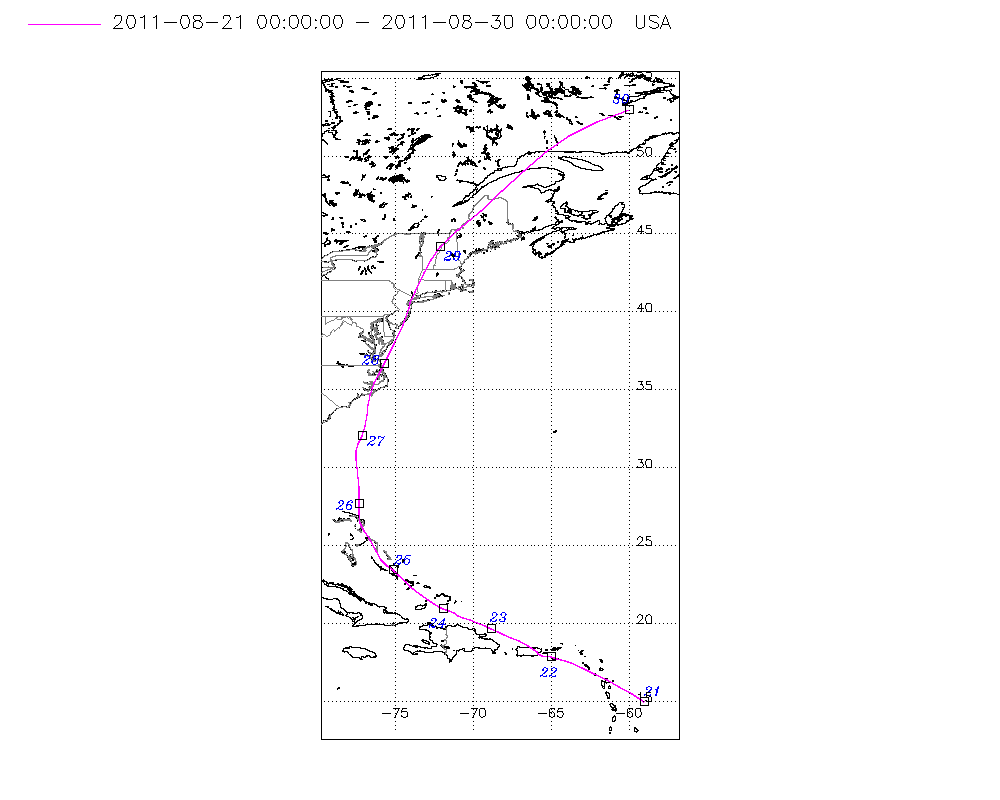
Hurricane Irene (2011) is actually included in LC20 as a tropical storm intensity landfall (60-knots) at 41.3°N -73.6°W which appears to be an error.
Regardless, the North Carolina landfall is certainly not a typical example of inland hurricane decay. Nor in New England. 🤷
Regardless, the North Carolina landfall is certainly not a typical example of inland hurricane decay. Nor in New England. 🤷
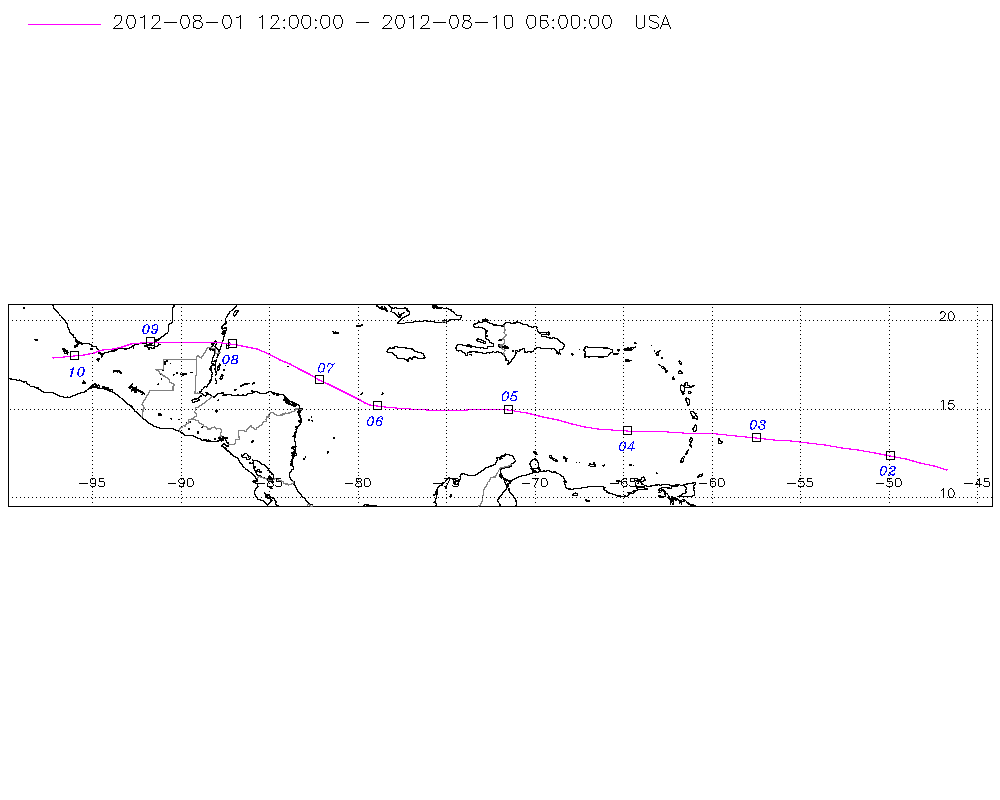
Hurricane Ernesto (2012) actually reemerges over water in the far southern Gulf of Mexico during the "inland decay" period as described by LC20. Not sure how this fits in the narrative of hurricane decay but it is a large value for sure.
Hurricane Sandy (2012) was not a hurricane at landfall -- it was post-tropical. It should not be included in this analysis.
Sandy exists on its own way off to the side. 🌀
Sandy exists on its own way off to the side. 🌀
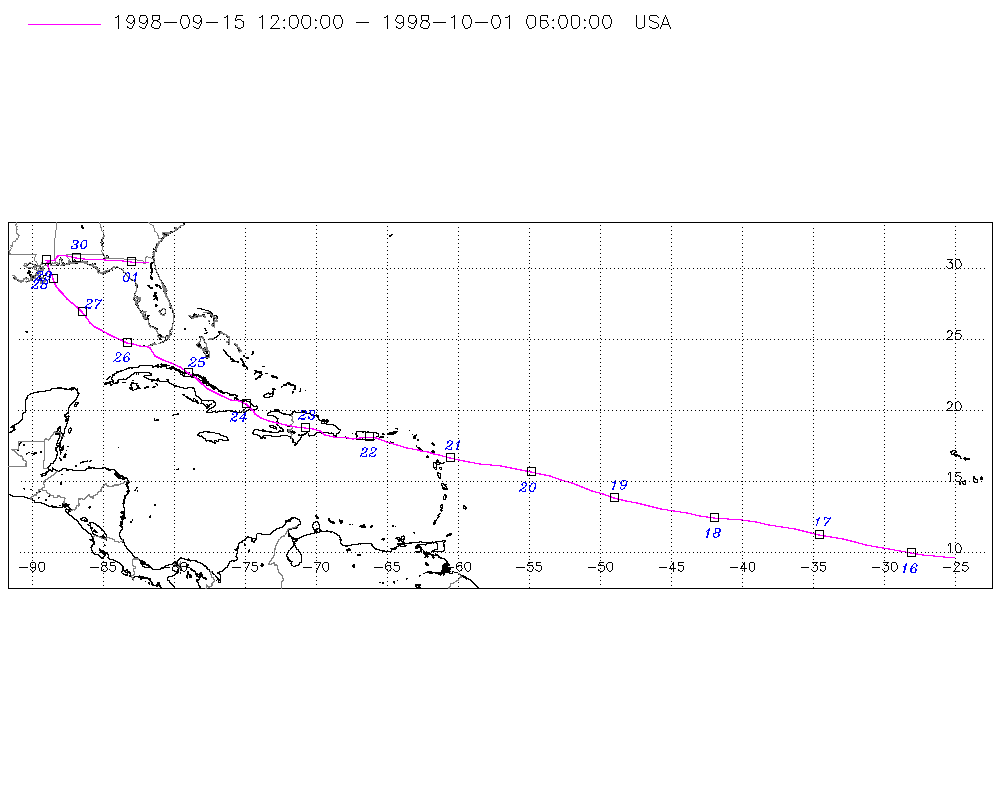
Hurricane Georges (1998) appears twice in the dataset. The largest value of tau (45.6) is associated with traversing Hispaniola, but for less than 24-hours. Again, this type of island crossing doesn't seem appropriate to include in this analysis.
Removing these handful of storms that (a) do not decay for 24-hours over land or (b) become extratropical, the dramatic recent signal vaporizes.
Indeed, compare Florence (2018) with Michael (2018).
Indeed, compare Florence (2018) with Michael (2018).
I was alerted to Hurricane Frances (2004) which crossed Florida and re-emerged in the Gulf of Mexico. It is included in LC20 but the crossing of Andrew over S. Florida is not. It is included for Louisiana landfall with a low tau (14.4)
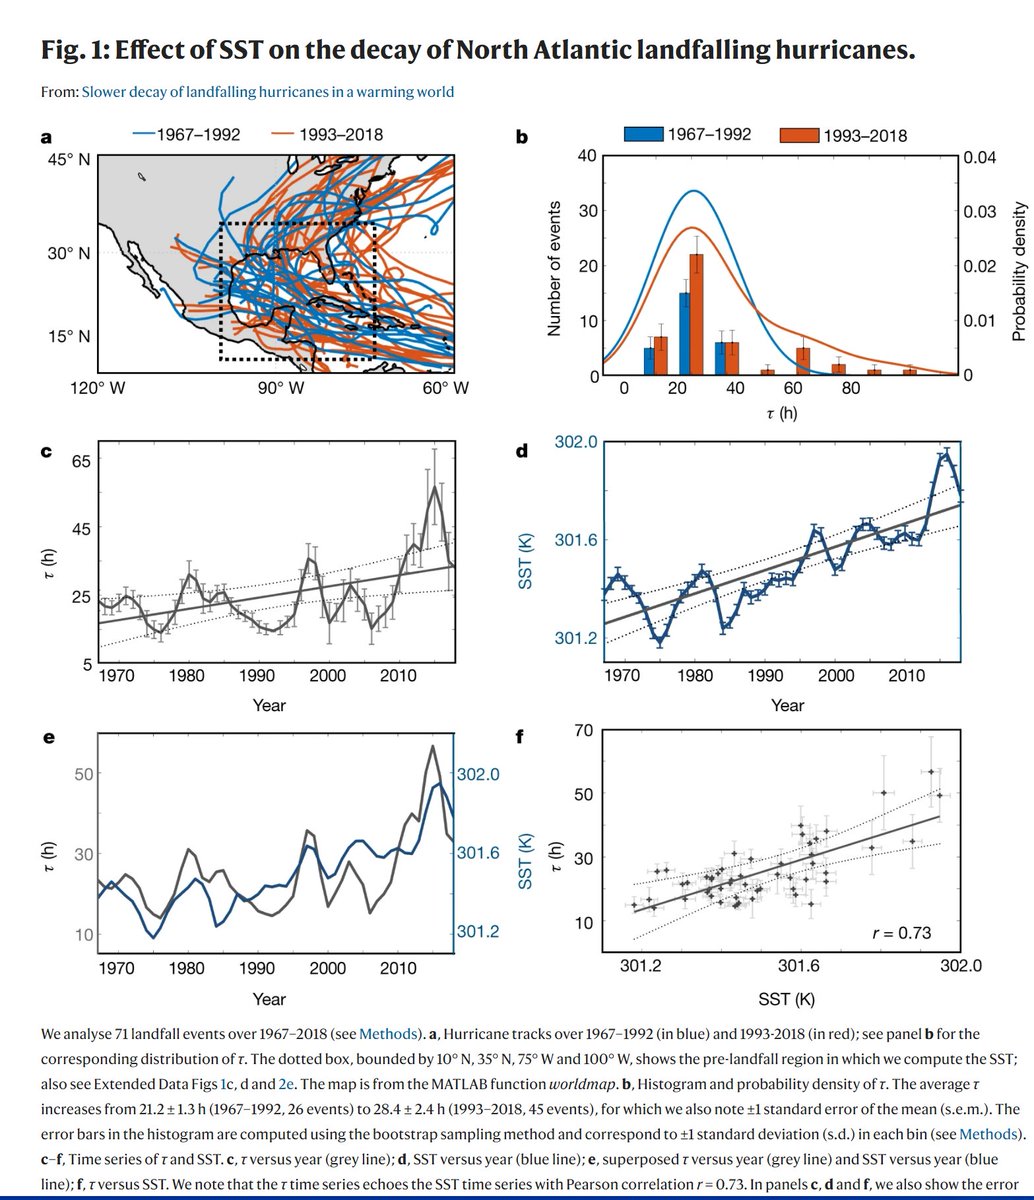
If I had been a reviewer of this paper, then I would have had serious questions about the methodology employed to determine "landfall". Upon examination of the most extreme cases, that is clearly a fatal flaw that completely upends the advertised conclusions thereafter.
For researchers that have followed the hurricanes & climate change beat for the past 15-20 years, alarm bells should go off when these time series are correlated with non-local SST metrics -- after heavy smoothing. (Yikes)
Figure 1c is screaming for further examination.
Figure 1c is screaming for further examination.
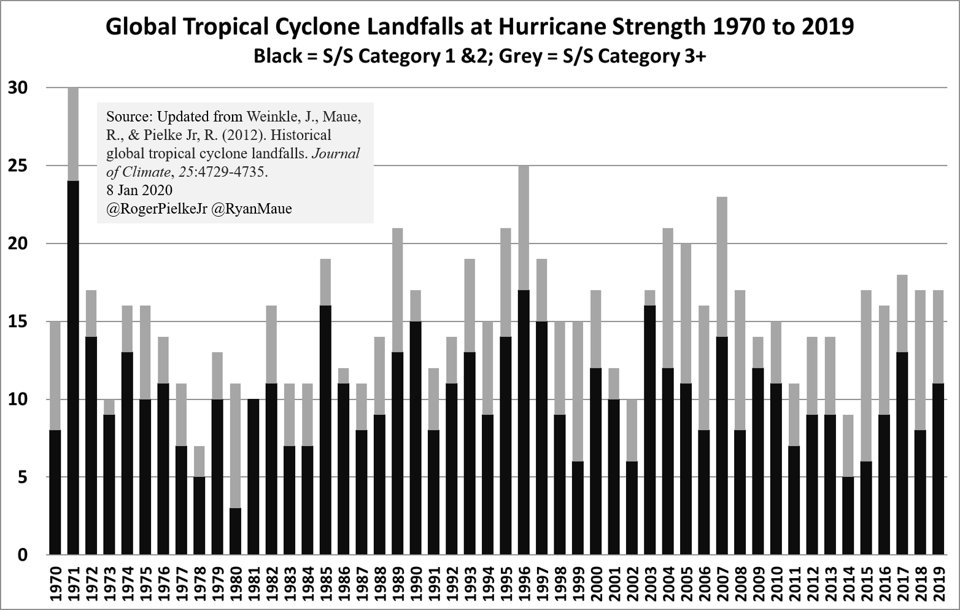
For street cred, @RogerPielkeJr and I have been updating a 2012 J. Climate paper on global hurricane landfalls (cited by LC20) where we examine now over 50-years of data.
forbes.com/sites/rogerpie…
Almost time to update for 2020!
forbes.com/sites/rogerpie…
Almost time to update for 2020!
• • •
Missing some Tweet in this thread? You can try to
force a refresh


