
Shall we do some analysis on a *really dumb* factor which might predict relative returns in stocks?
"Are cheap stocks expensive?"
A research thread 👇👇👇
"Are cheap stocks expensive?"
A research thread 👇👇👇
Options on stocks with a low share price tend to be overpriced.
Equity options (at 100 shares a pop) are quite big for a small retail trader. So we might say there is excess retail demand for options on cheap stocks - which would result in them being overpriced.
Equity options (at 100 shares a pop) are quite big for a small retail trader. So we might say there is excess retail demand for options on cheap stocks - which would result in them being overpriced.
But are low priced stocks also expensive?
The AMZN share price is $3k+. There are Robinhooders who can't afford a single stock.
Do we see the same effect in Stocks as we do in the options?
The AMZN share price is $3k+. There are Robinhooders who can't afford a single stock.
Do we see the same effect in Stocks as we do in the options?
I'm going to analyse this in R - using datasets from the Robot Wealth research lab.
My raw price data looks like this.
I have daily OHLC for every stock that appeared in the Russell 1000 index over the last 20 years. (Whether it still exists or not)
My raw price data looks like this.
I have daily OHLC for every stock that appeared in the Russell 1000 index over the last 20 years. (Whether it still exists or not)
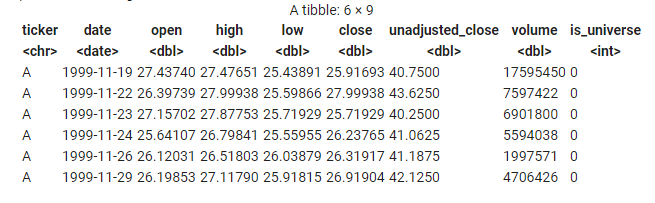
The OHLC points are adjusted for splits and dividends.
The unadjusted_close price is the price the stock actually closed on that day
If the stock didn't trade that day we still have a row. It has volume = 0
If the stock was not in the index that day then is_universe = 0
The unadjusted_close price is the price the stock actually closed on that day
If the stock didn't trade that day we still have a row. It has volume = 0
If the stock was not in the index that day then is_universe = 0
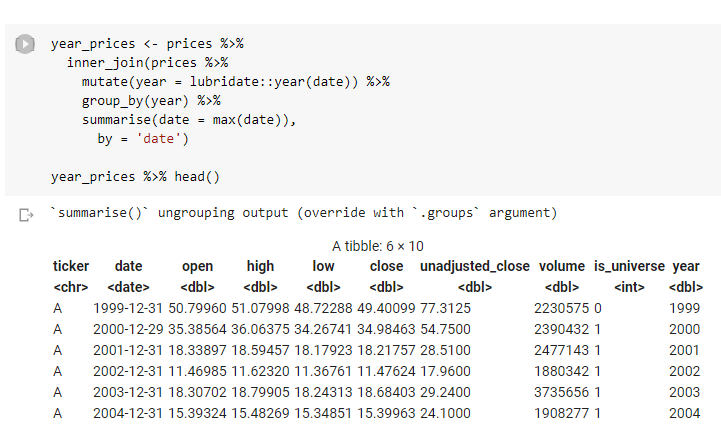
I don't need daily data. I'm trying to answer a pretty dumb question here.
So let's keep things simple.
I'm going to just get snapshots of the prices on the last day of each calendar year.
So let's keep things simple.
I'm going to just get snapshots of the prices on the last day of each calendar year.
(Always keep stuff simple for yourself. At the start of a piece of analysis you're just trying to quickly disprove an idea.
Most ideas are bad and the market is super-efficient. So make life easy, move fast, and disprove fast.)
Most ideas are bad and the market is super-efficient. So make life easy, move fast, and disprove fast.)
Borrowing the language of machine learning for my trivial analysis (cos it's precise) I now need to prepare:
- the target (the thing I am trying to predict)
- the feature (the thing I hope is predictive)
- the target (the thing I am trying to predict)
- the feature (the thing I hope is predictive)
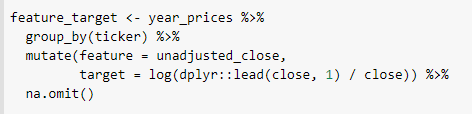
My (raw) target is going to be log returns of the stock over a year
My (raw) feature is going to be the unadjusted close price of the stock at the end of the previous year.
Here I calculate the feature and target and align them in a single data set
My (raw) feature is going to be the unadjusted close price of the stock at the end of the previous year.
Here I calculate the feature and target and align them in a single data set
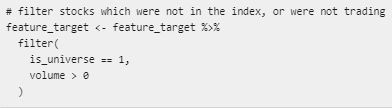
I've calculated those for all the stocks, including on days when those stocks weren't in the Russell 1000 index.
So now I filter out the days when the stock wasn't in the index and days when a given stock didn't trade (due to halt or whatever)
So now I filter out the days when the stock wasn't in the index and days when a given stock didn't trade (due to halt or whatever)
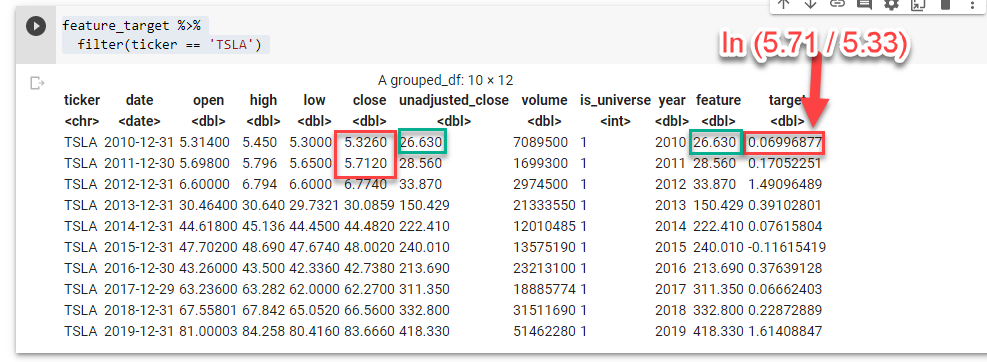
Always assume you've screwed it up. Check. Here I spot check on TSLA.
Looks good.
The feature is just the unadjusted close at the end of the year.
The target is the log returns over the next year
Looks good.
The feature is just the unadjusted close at the end of the year.
The target is the log returns over the next year
Now we're ready to do some scaling and sorting.
We don't want to work with the raw feature. We're looking to answer a very broad question here and large numbers are our friend.
So we want to sort and group our data so we can aggregate it effectively.
We don't want to work with the raw feature. We're looking to answer a very broad question here and large numbers are our friend.
So we want to sort and group our data so we can aggregate it effectively.
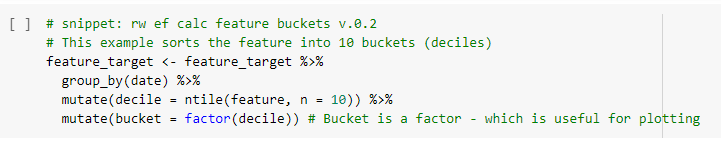
We'll scale our feature by sorting each stock into one of 10 buckets each year
Bucket 1 will contain the stocks in the index with the lowest (unadjusted) share price that year
Bucket 10 will contain the stocks in the index with the highest (unadjusted) share price that year
Bucket 1 will contain the stocks in the index with the lowest (unadjusted) share price that year
Bucket 10 will contain the stocks in the index with the highest (unadjusted) share price that year
We call these deciles if we are fancy. I usually call them buckets.
To understand what that has done we plot a histogram of all our feature observations and colour it by the bucket it ended up in...

Now we've reduced our raw feature into 10 buckets. That will be helpful.
Our next task is to think about scaling the target.
We're really more interested in *relative* (rather than absolute) returns "Did the cheap stuff perform better than the expensive stuff this year"
Our next task is to think about scaling the target.
We're really more interested in *relative* (rather than absolute) returns "Did the cheap stuff perform better than the expensive stuff this year"
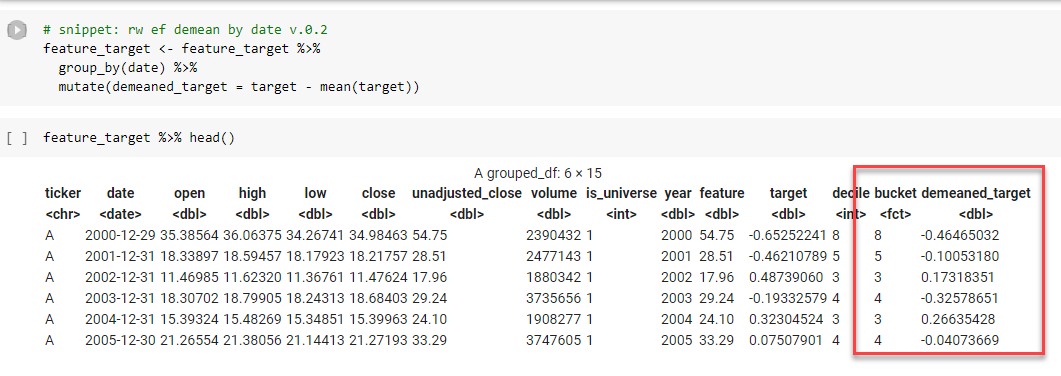
So we "de-mean" the target by subtracting the mean returns of all stocks that year from the yearly returns for each stock in our universe.
The data now look like this. I've highlighted the scaled feature (bucket) and target (demeaned_target)
The data now look like this. I've highlighted the scaled feature (bucket) and target (demeaned_target)
Now we want to see if the really low priced stuff that ended up in bucket 1 had lower returns than the really high priced stuff that ended up in bucket 10.
So we take our observations, group by bucket and plot the mean of next years (de-meaned) returns for each bucket.
So we take our observations, group by bucket and plot the mean of next years (de-meaned) returns for each bucket.
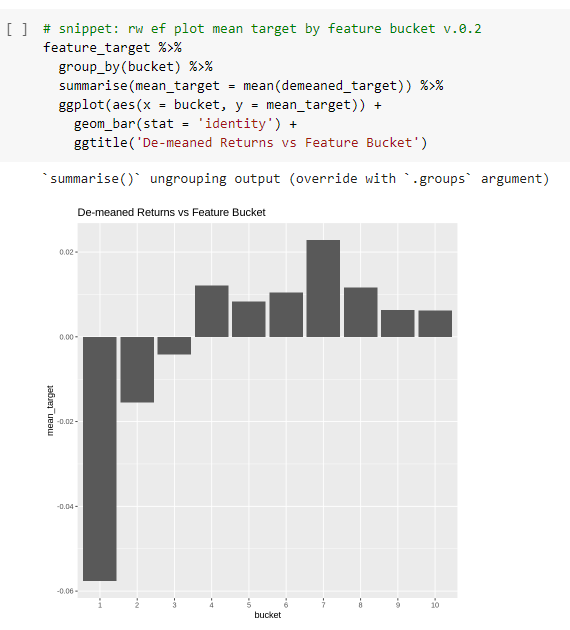
Interestingly... we do appear to see - at least over the whole sample - the annual returns of the cheap stocks is significantly (6-7%) lower than the returns of the more expensive stocks.
I haven't lost interest yet...
I haven't lost interest yet...
So let's create one of those plots for each of the 22 years in the sample.
We want to get a feel for whether we see this pattern consistently.
We want to get a feel for whether we see this pattern consistently.
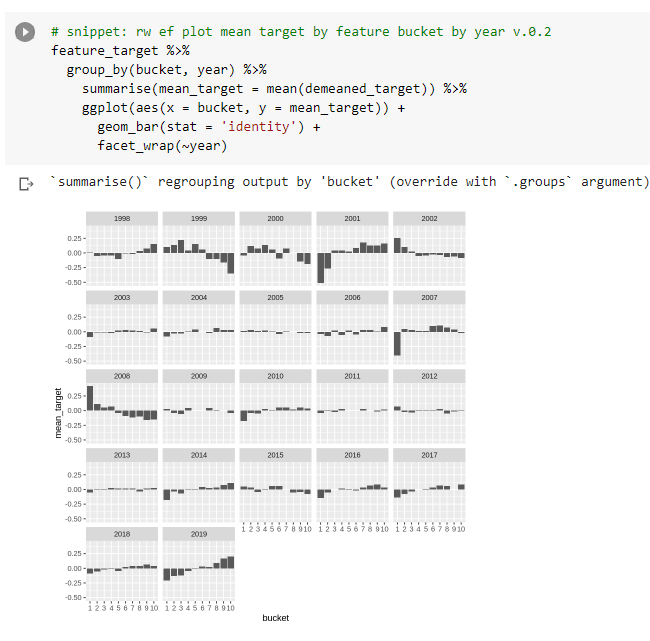
Looks quite consistent... The relative shapes of 2000/2001 and 2007/2008 are interesting and point to this effect likely having some explanatory variable we already know about such as a beta / size / reversion effect...
Let's not worry about that yet... move fast and loop back
Let's not worry about that yet... move fast and loop back
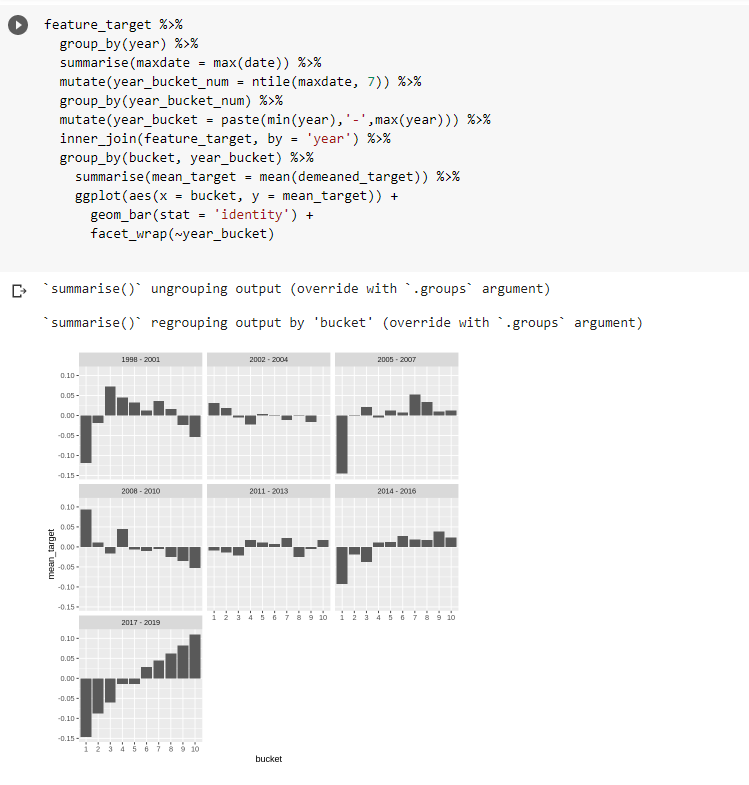
To make this thing more readable i'm going to group into groups of about 3 years and plot them.
Woah there 2017-2019... makes me wonder whether i've introduced some bias (or my unadj close is correct). something to look at....
Woah there 2017-2019... makes me wonder whether i've introduced some bias (or my unadj close is correct). something to look at....
To complete our superficial analysis, let's plot a cumulative return time series of a strategy that goes long the 10% with the highest share price and the 0% with the lowest share price.
Long bucket 10, short bucket 1
Long bucket 10, short bucket 1
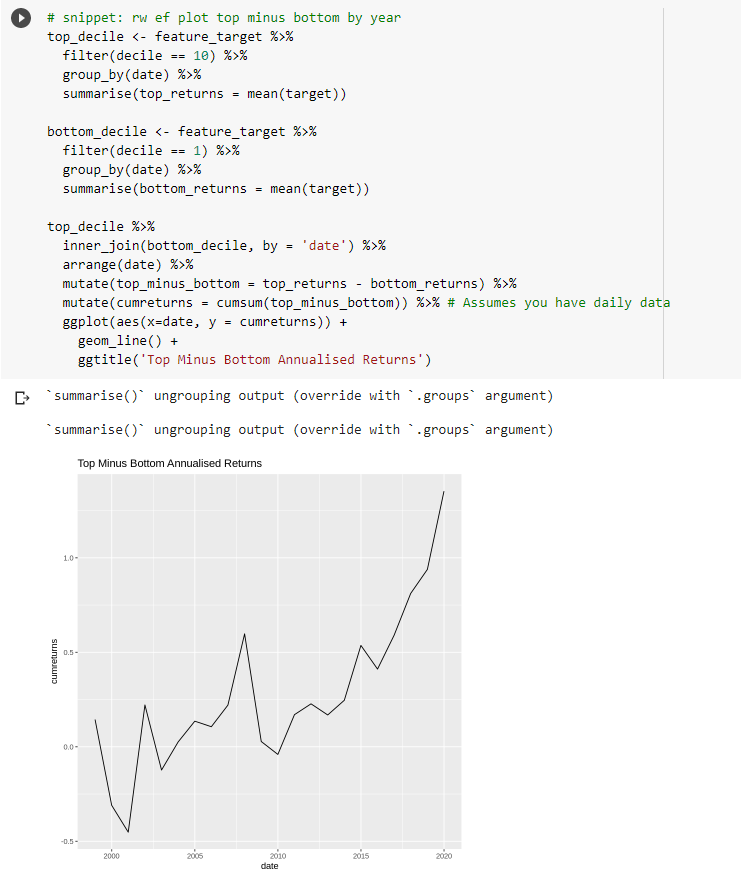
Very interesting... I'm quite surprised at the results of this... I thought I would find nothing. Or at, least, an incredibly noisy effect.
Two main things to do now
1. Get more acquainted with unadjusted close data to ensure it's correct and I'm not introducing helpful bias
Two main things to do now
1. Get more acquainted with unadjusted close data to ensure it's correct and I'm not introducing helpful bias
2 Try to isolate this from any other casual factors we already know about (size, reversion from big moves, beta effect)
But I'll leave this here for now.
There is a *suggestion* that cheaper stocks are expensive.
But I'll leave this here for now.
There is a *suggestion* that cheaper stocks are expensive.
• • •
Missing some Tweet in this thread? You can try to
force a refresh


