@drummergirl68 and @HankSullivan1 with further info on The Great Heist of 2020: GA

Read FULL Thread and reference these diagrams: Image
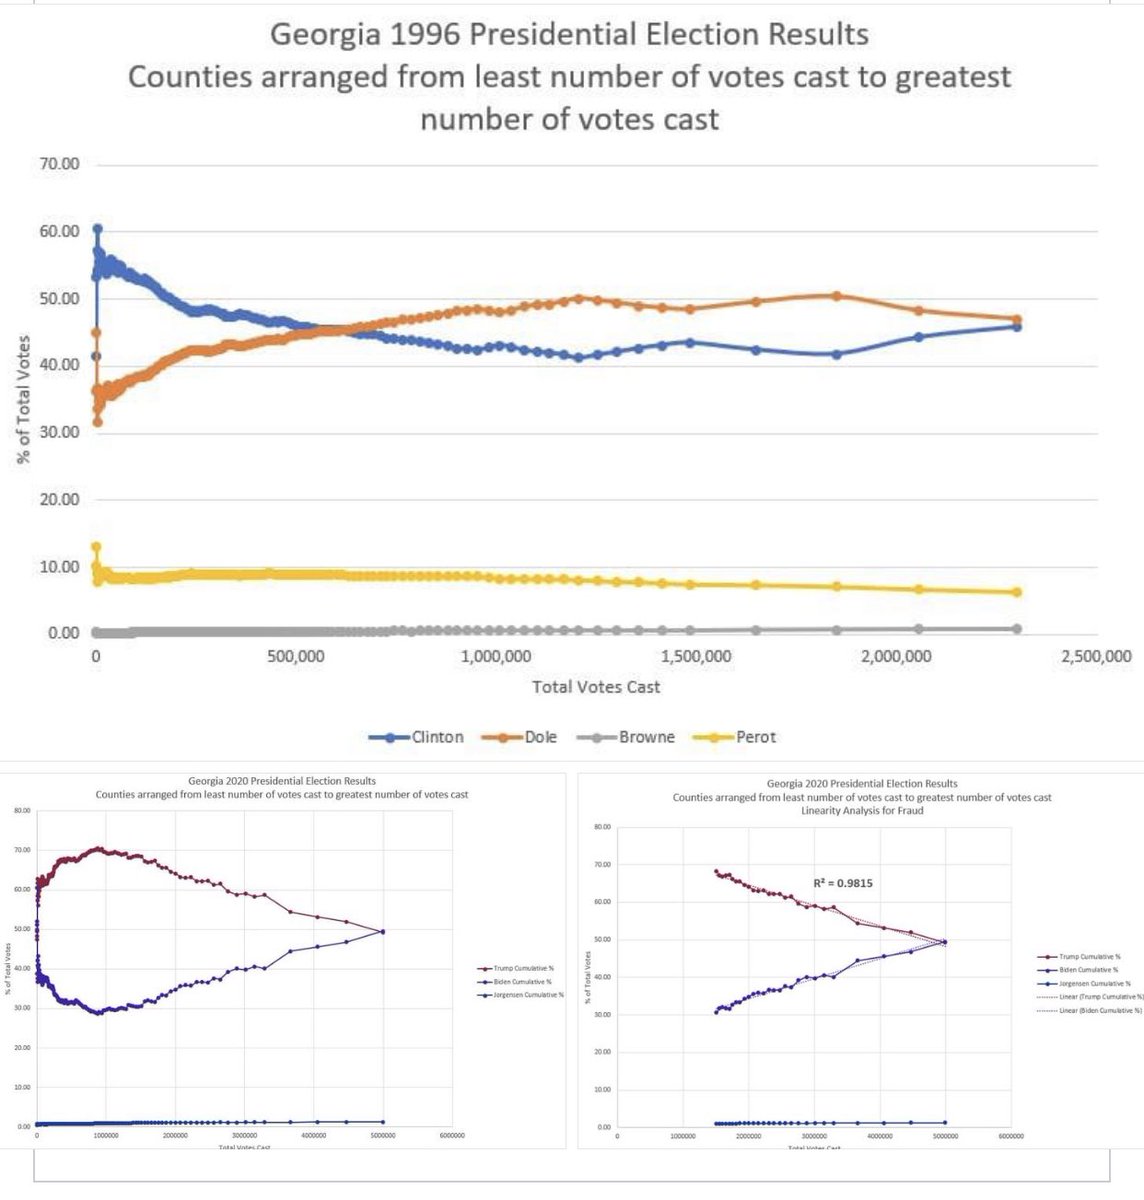
In these three shots can easily be seen the formula for the election fraud in Georgia. First, look at the results from 1996, an election prior to the time any of the election fraud tools we see today had been invented.
In 1996 graph, notice that from left to right, from least populated counties to most populated, the tallies as they add up flatten out, which means that there is no dependence imparted from the results of one county to the results of each next higher populated county
Now 2020. Once the election began being carried away by Trump, a formula involving a multiplication factor operated on the results of each larger county, making the results of each next larger county the same % appear more popular for Biden and less popular for Trump.
3rd graph the slope of this line is over 98% linear, which means that moment Trump was running away with the vote & the fraud operation began, the computer used a factor.
In the end was uniform throughout those counties, the magnitude of which was calculated to in the end to overcome the massive lead Trump was building up and yield a razor thin margin of victory for Biden.
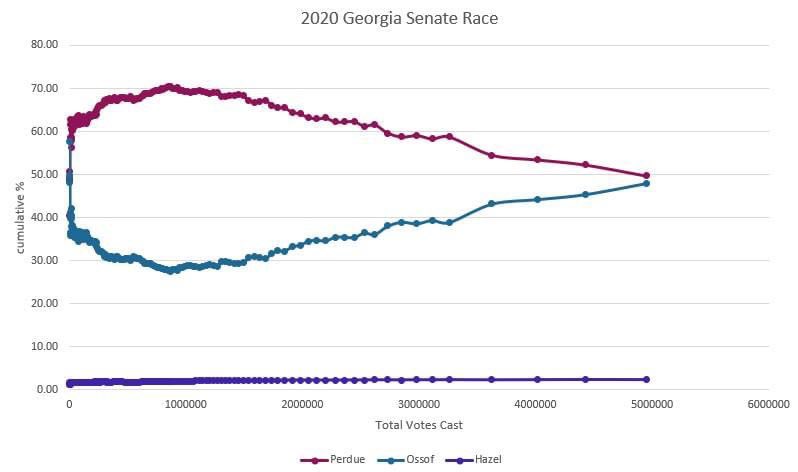
@drummergirl68 is the statistician who compiled the data and plotted the results. According to her, Georgia's down ballot races yield the same conclusion of fraud.

• • •

Missing some Tweet in this thread? You can try to force a refresh
 

Keep Current with 𝕁𝔽𝕂 𝕋𝕖𝕓𝕠𝕨 🏈 🇺🇸

𝕁𝔽𝕂 𝕋𝕖𝕓𝕠𝕨 🏈 🇺🇸 Profile picture

Stay in touch and get notified when new unrolls are available from this author!

Read all threads

This Thread may be Removed Anytime!

PDF

Twitter may remove this content at anytime! Save it as PDF for later use!

Try unrolling a thread yourself!

how to unroll video
  1. Follow @ThreadReaderApp to mention us!

  2. From a Twitter thread mention us with a keyword "unroll"
@threadreaderapp unroll

Practice here first or read more on our help page!

More from @JfkTebow

21 Nov
🚨 Spread this TRUTH everywhere Patriots!! 🚨
Voter fraud PROOF in multiple states including VERMONT.

Use these next slides as reference for the FULL THREAD below.

@SidneyPowell1 @LLinWood ImageImageImage
More mathematical analysis of the election. On the presidential front, I went fishing for a state where we would not see vote flipping. Epic failure. Vermont is flipping like hotcakes at the IHOP on Sunday.
The question is why? Biden starts flipping when he has 56% of the vote; a predictable, solid lead in a very blue state. I'm not sure what it means other than another 35,000 votes taken from the Trump column and awarded to Biden.
Read 6 tweets
17 Nov
I have a BRILLIANT friend, a great patriot who is learned in statistical analysis. She took the 2020 Georgia Presidential election data from the Secretary of State's website and plotted it onto a graph, which I will greatly simplify for you. So stay with me....read full thread.
She took each county's totals, least populated counties on the left, in order of increasing population, to the most populated, in order, as you proceed to the right. And what she discovered is a phenomenon that cannot be explained through natural demographics.
Look at the slope of the line I have highlighted for you. If true, what this uniform slope is telling you is that on election day Biden was the exact same percentage more popular than Trump in each consecutive, more populated county in the state. READ THAT AGAIN till ya get it
Read 10 tweets

Did Thread Reader help you today?

Support us! We are indie developers!


This site is made by just two indie developers on a laptop doing marketing, support and development! Read more about the story.

Become a Premium Member ($3/month or $30/year) and get exclusive features!

Become Premium

Too expensive? Make a small donation by buying us coffee ($5) or help with server cost ($10)

Donate via Paypal Become our Patreon

Thank you for your support!

Follow Us on Twitter!