🚨 Spread this TRUTH everywhere Patriots!! 🚨
Voter fraud PROOF in multiple states including VERMONT.
Use these next slides as reference for the FULL THREAD below.
@SidneyPowell1 @LLinWood
Voter fraud PROOF in multiple states including VERMONT.
Use these next slides as reference for the FULL THREAD below.
@SidneyPowell1 @LLinWood

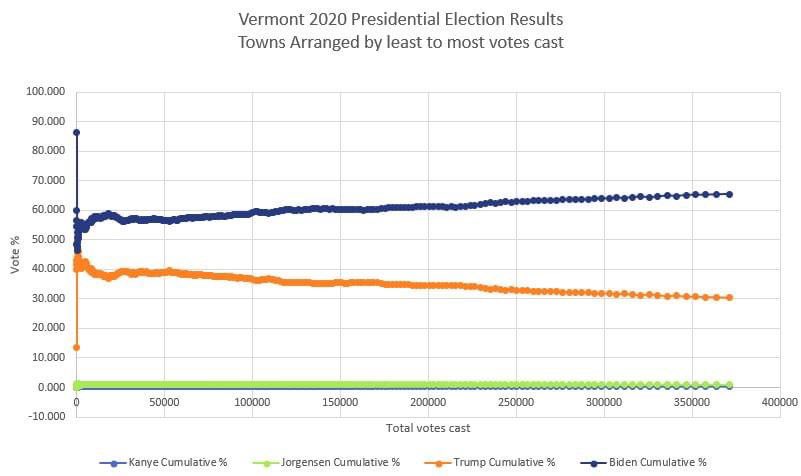
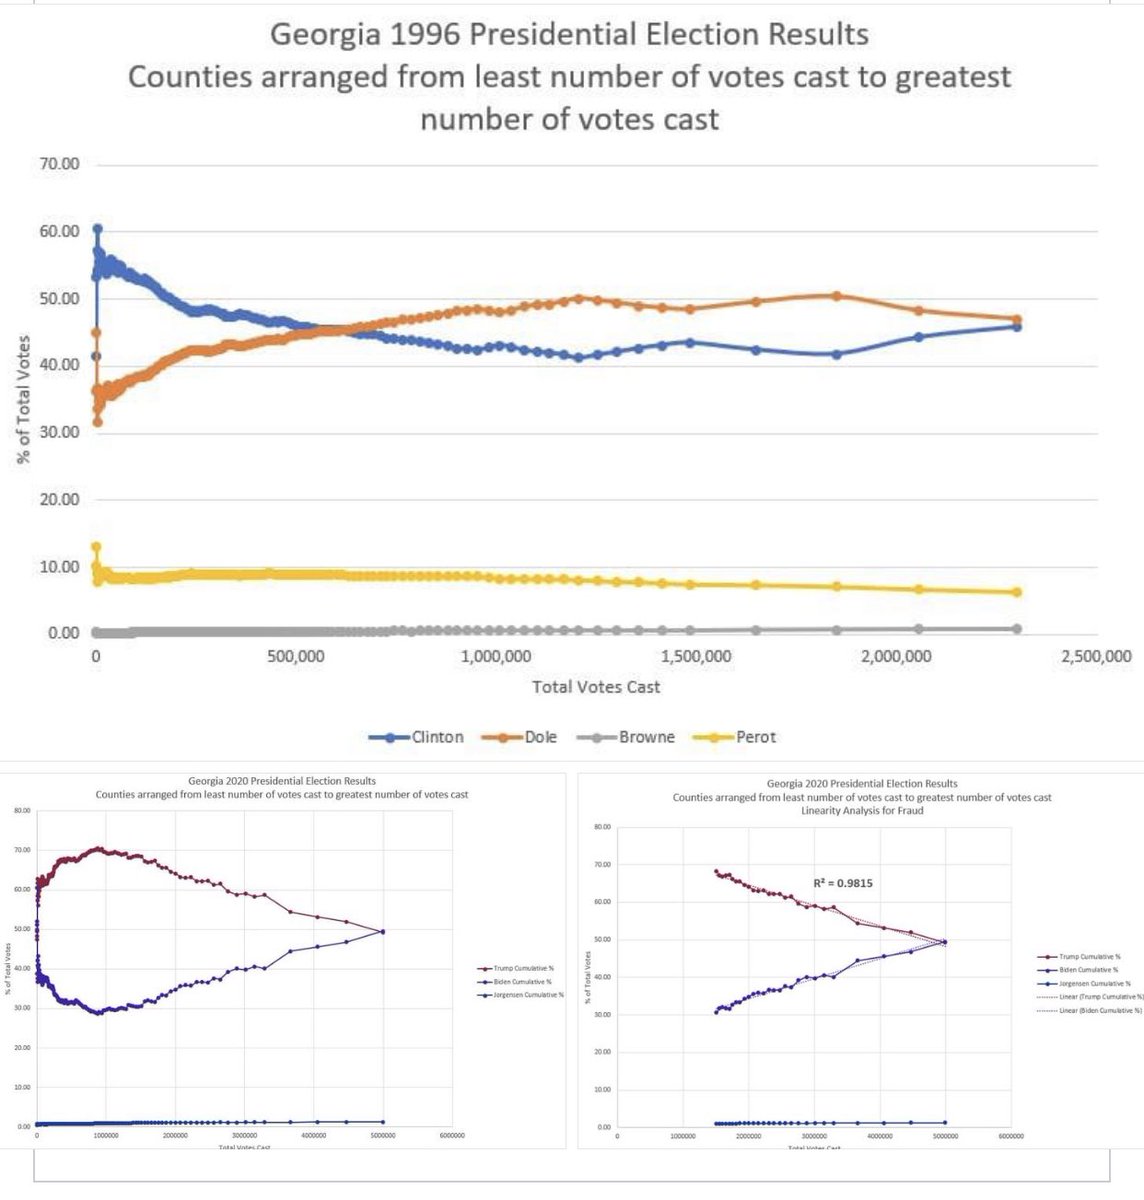
More mathematical analysis of the election. On the presidential front, I went fishing for a state where we would not see vote flipping. Epic failure. Vermont is flipping like hotcakes at the IHOP on Sunday.
The question is why? Biden starts flipping when he has 56% of the vote; a predictable, solid lead in a very blue state. I'm not sure what it means other than another 35,000 votes taken from the Trump column and awarded to Biden.
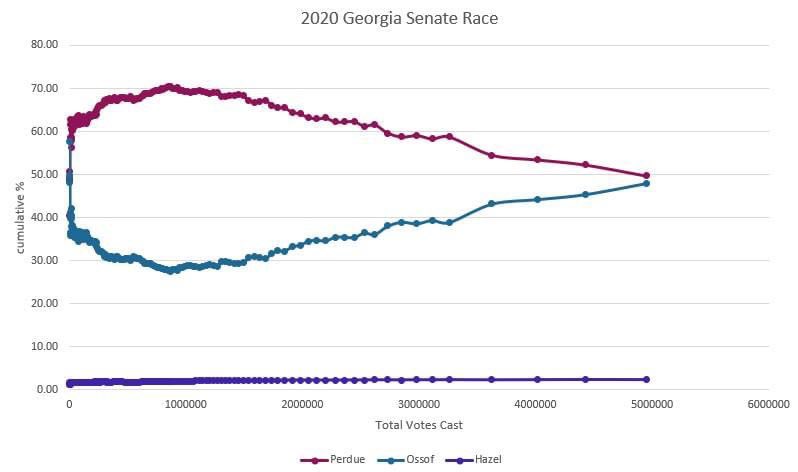
Meanwhile back in Georgia, I took a dive into the senate races where the situation is WORSE than in the presidential race (did not think that was possible). IMHO, Perdue should sue for his senate seat and Doug Collins should sue for his spot in the runoff.
Just to clarify - BOTH Georgia senate seats were HIJACKED by vote flipping. In Collins' case, there's also clear and egregious ballot box stuffing in Dekalb and Fulton counties. Math says so. All Georgia data taken from the Georgia SOS website.
Someone asked about Maine. Here is message from the brain trust @drummergirl68
Yes and no. Maine has a contingency ballot system that is different than any other state. So I’m definitely curious to see what’s going on there. However, it may be awhile before I can get to it.
Yes and no. Maine has a contingency ballot system that is different than any other state. So I’m definitely curious to see what’s going on there. However, it may be awhile before I can get to it.
• • •
Missing some Tweet in this thread? You can try to
force a refresh