
Understanding the Danish Mask Study:
1/
Whenever possible, you should always run your trial in software to see if the study design is sound, and capable of delivering the results. A power analysis is a start, but a simulation is better.
1/
Whenever possible, you should always run your trial in software to see if the study design is sound, and capable of delivering the results. A power analysis is a start, but a simulation is better.
2/ @Lester_Domes
The study uses the classic Frequentist analysis with p-values. We will leave that conversation for another time.
Here we start with the actual study data and run the study a million times and observe the range of raw counts as well as the range of percentages.
The study uses the classic Frequentist analysis with p-values. We will leave that conversation for another time.
Here we start with the actual study data and run the study a million times and observe the range of raw counts as well as the range of percentages.


3/
Grps in orig stdy slightly different sizes. To make it easier to understand, we make grps equal at 2,431.
The orig trial observed a raw difference of 11 btwn grps.
Here, we run the trial 1M times and ~3/4 of the time < 11 difference, ~1/4 >11 difference in raw counts.
Grps in orig stdy slightly different sizes. To make it easier to understand, we make grps equal at 2,431.
The orig trial observed a raw difference of 11 btwn grps.
Here, we run the trial 1M times and ~3/4 of the time < 11 difference, ~1/4 >11 difference in raw counts.

4/
They powered the study to give an 80% chance of detecting a 50% RRR or ARR of 2%-->1%.
As noted, ~3/4 of the time, the difference will be < ~0.5%, 1/4 of the time it will be larger.
A random pure statistical variation difference of > 1% will occur < 2% of the time.
They powered the study to give an 80% chance of detecting a 50% RRR or ARR of 2%-->1%.
As noted, ~3/4 of the time, the difference will be < ~0.5%, 1/4 of the time it will be larger.
A random pure statistical variation difference of > 1% will occur < 2% of the time.


5/
The take-home of 1/-5/ is if we observe an absolute difference of ~24 in raw counts btwn grps, or ~1.0% in "infection", we might reasonably conclude that "masks reduce risk of infection."
But then:
brain.mpg.de/fileadmin/user…
The observation is (true effect + random variation)
The take-home of 1/-5/ is if we observe an absolute difference of ~24 in raw counts btwn grps, or ~1.0% in "infection", we might reasonably conclude that "masks reduce risk of infection."
But then:
brain.mpg.de/fileadmin/user…
The observation is (true effect + random variation)

6/
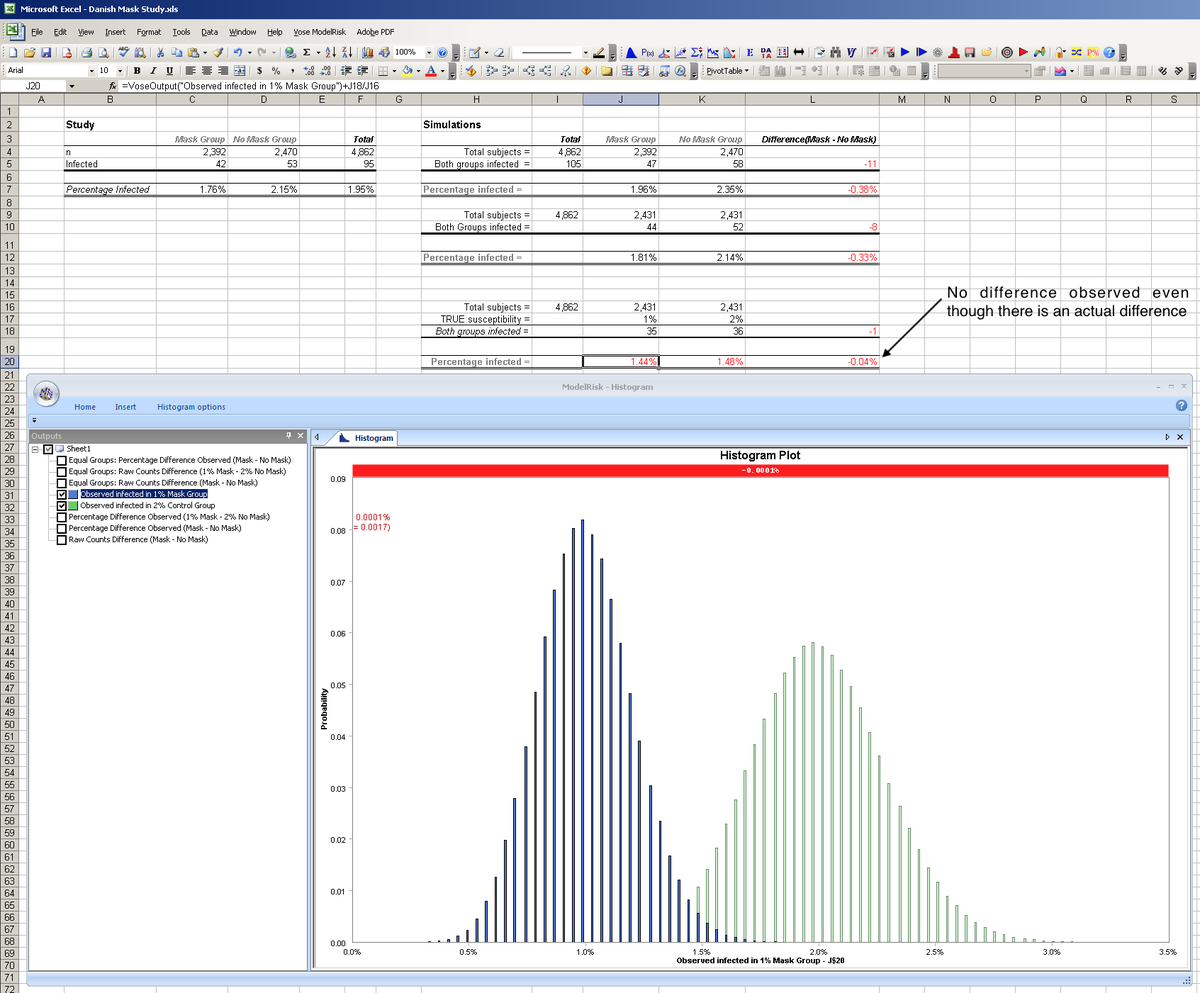
We may now play God & assign Truth to Mask & Control Grps see what the range of observations are.
We assign:
Mask = 1%
Control = 2%
as done in the power analysis.
In this particular trial, we observe:
Masks = 0.99%
No Masks = 2.02%
We observe a difference of 1.03% 🍀
We may now play God & assign Truth to Mask & Control Grps see what the range of observations are.
We assign:
Mask = 1%
Control = 2%
as done in the power analysis.
In this particular trial, we observe:
Masks = 0.99%
No Masks = 2.02%
We observe a difference of 1.03% 🍀

7/
The random statistical variation in the observations leads to statistical variation in the observed difference.
This can result in observing no difference where there actually is a difference, or observing double (or more) the actual difference-->a distribution in difference
The random statistical variation in the observations leads to statistical variation in the observed difference.
This can result in observing no difference where there actually is a difference, or observing double (or more) the actual difference-->a distribution in difference

8/
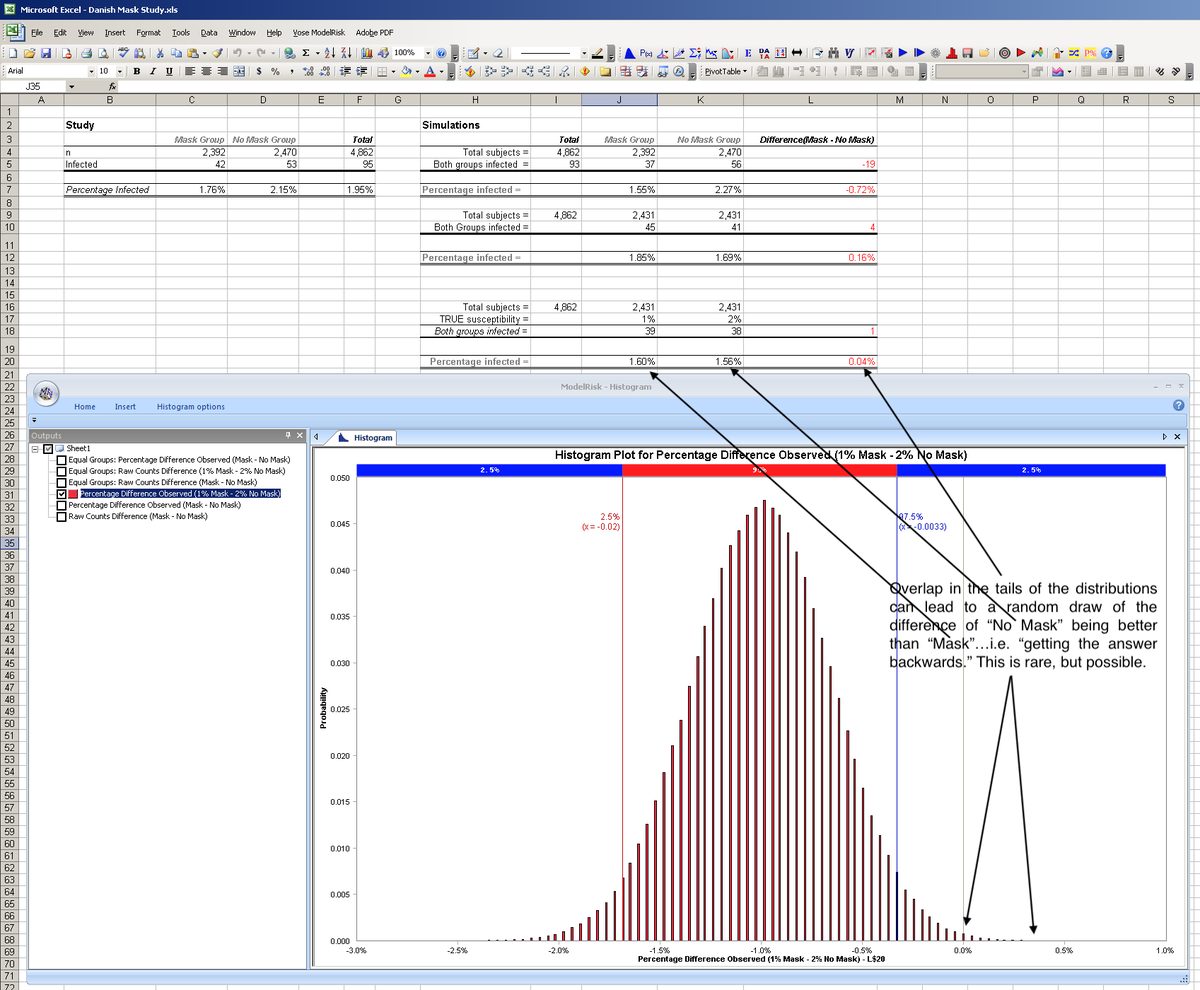
We model the distribution of the difference between a simulated 1% Mask Grp & 2% No Mask Grp.
In any trial, we'll observe the % susceptible in each grp which will vary around Truth, & the difference will vary around Truth...but we never know if we got it right or backwards...
We model the distribution of the difference between a simulated 1% Mask Grp & 2% No Mask Grp.
In any trial, we'll observe the % susceptible in each grp which will vary around Truth, & the difference will vary around Truth...but we never know if we got it right or backwards...

9/
This is a known human weakness...understanding the behavior of ensembles & statistical variation. If we had any understanding of that at all, we would have seen this bug as normal statistical variation of the herd of bugs.
Distribution in CFR
Distribution in Susceptibility
This is a known human weakness...understanding the behavior of ensembles & statistical variation. If we had any understanding of that at all, we would have seen this bug as normal statistical variation of the herd of bugs.
Distribution in CFR
Distribution in Susceptibility


10/
Distribution in just those to things leads to a distribution in mortality. Some years it's a little, some years it's a lot.
Distribution in just those to things leads to a distribution in mortality. Some years it's a little, some years it's a lot.


@threadreaderapp unroll
• • •
Missing some Tweet in this thread? You can try to
force a refresh


