
New cases were up significantly in both Ventura County and California. The surge in VC is now bigger than the surge in the summer. The virus is winning. #Covid19 data as of 11/20/20 from the CA Open Data Portal.
1/11
1/11
Total Cases VC: 17741, CA: 1087714
Total Hosp VC: 65, CA: 4989
Total ICU VC: 29, CA: 1227
Total Death VC: 174, CA: 18643
2/11
Total Hosp VC: 65, CA: 4989
Total ICU VC: 29, CA: 1227
Total Death VC: 174, CA: 18643
2/11
Change in Cases VC: 441, CA: 15442
Change in Hosp VC: 11, CA: 234
Change in ICU VC: 3, CA: -13
Change in Death VC: 0, CA: 86
3/11
Change in Hosp VC: 11, CA: 234
Change in ICU VC: 3, CA: -13
Change in Death VC: 0, CA: 86
3/11
New cases are up significantly over the 14-day trends in both VC and CA. In VC, this represents 2.6-fold over the prediction. The rate of new cases in VC is 175 cases/day compared to the highest point in July when it was 158.
4/11
4/11


Hospitalization is up significantly in VC and well above prediction in CA. The number in ICU rose close to the 14-day trend line. Death rate is at 0.38 deaths/day in VC (range 0.36-0.40) and 44 deaths/day in CA (range 43-46) (30-day averages).
5/11
5/11
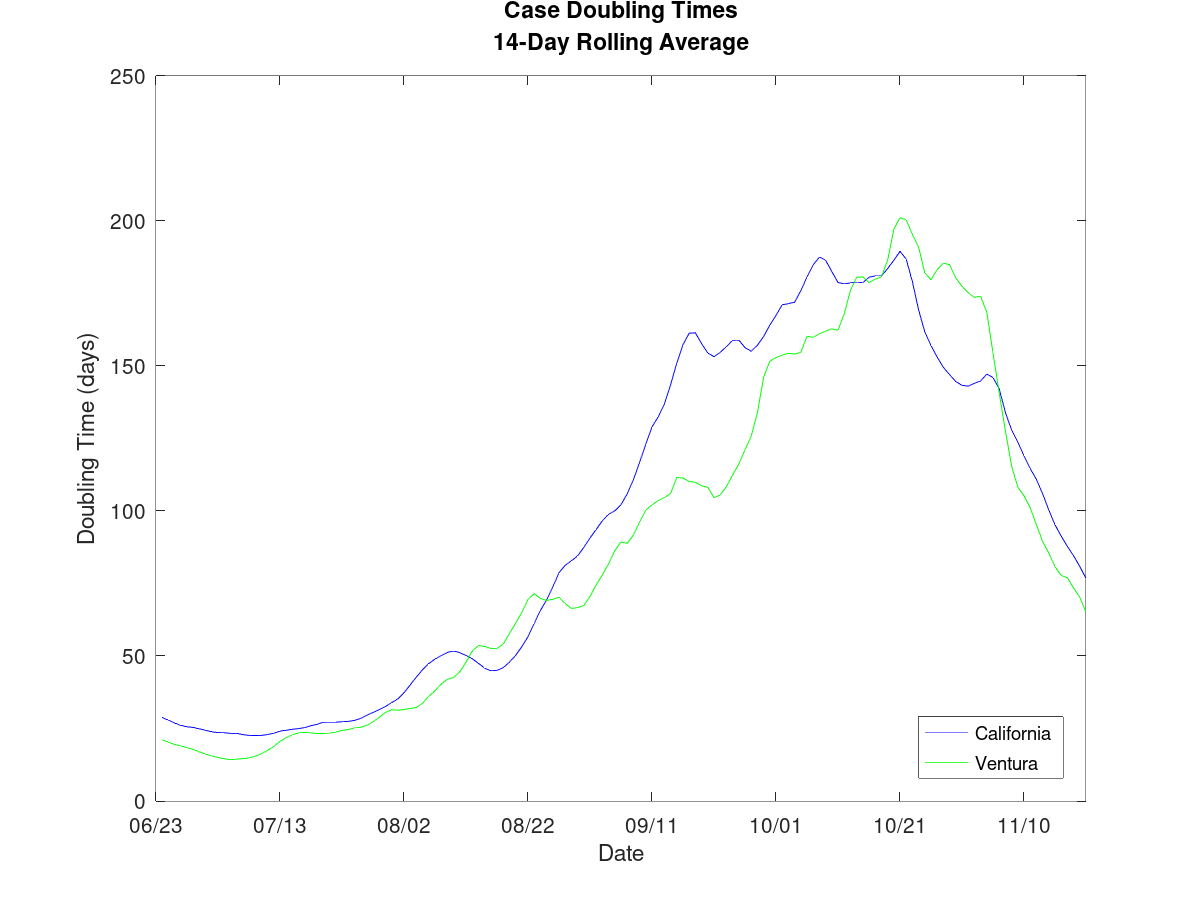
Doubling times for new cases are at 65 (range 60-72) days in VC and 77 (range 72-82) days in CA. New cases in VC averages 175 (range 156-193) per day and 9221 (range 8495-9947) per day in CA. (14-day averages)
6/11
6/11

Predictions for tomorrow:
VC new cases 187. CA new cases 9785.
If the actual number is lower, the humans are winning.
7/11
VC new cases 187. CA new cases 9785.
If the actual number is lower, the humans are winning.
7/11
There has been some discussion on the use of 7-day or 14-day rolling averages. The covid case data has enough regular (weekly) fluctuations in the daily rates to warrant some sort of averaging. No one wants policies changing from day to day. Weekly averaging helps remove
8/11
8/11
day-to-day variation. Using a 7-day rolling average still leaves a weekly signature (bumps in this graph around Sept-Oct). The state of CA decided to use a 7-day rolling average for county risk levels. By the way, the bottom of the bumps in the Risk Level plot usually
9/11
9/11

occur on a Tuesday or Wednesday, which is the day that the state decides to change the county risk level. Not a coincidence. If a 14-day average is used, the bumps are nearly gone. The big trends are still present. The big trends are what policy should be based on.
10/11
10/11

My analysis relies on 14-day averages as they produce a more stable analysis and prediction. I will occasionally report the Risk Level plot because that is what the state is using to make decisions.
11/11
11/11
• • •
Missing some Tweet in this thread? You can try to
force a refresh


