
In 1950 a period in planetary history unlike any other began.
You know about CO2 increase.
But CO2 was just one indicator among many others that things were - are - going very wrong.
Scientists have dubbed this The Great Acceleration.
A thread (with charts) 1/
You know about CO2 increase.
But CO2 was just one indicator among many others that things were - are - going very wrong.
Scientists have dubbed this The Great Acceleration.
A thread (with charts) 1/
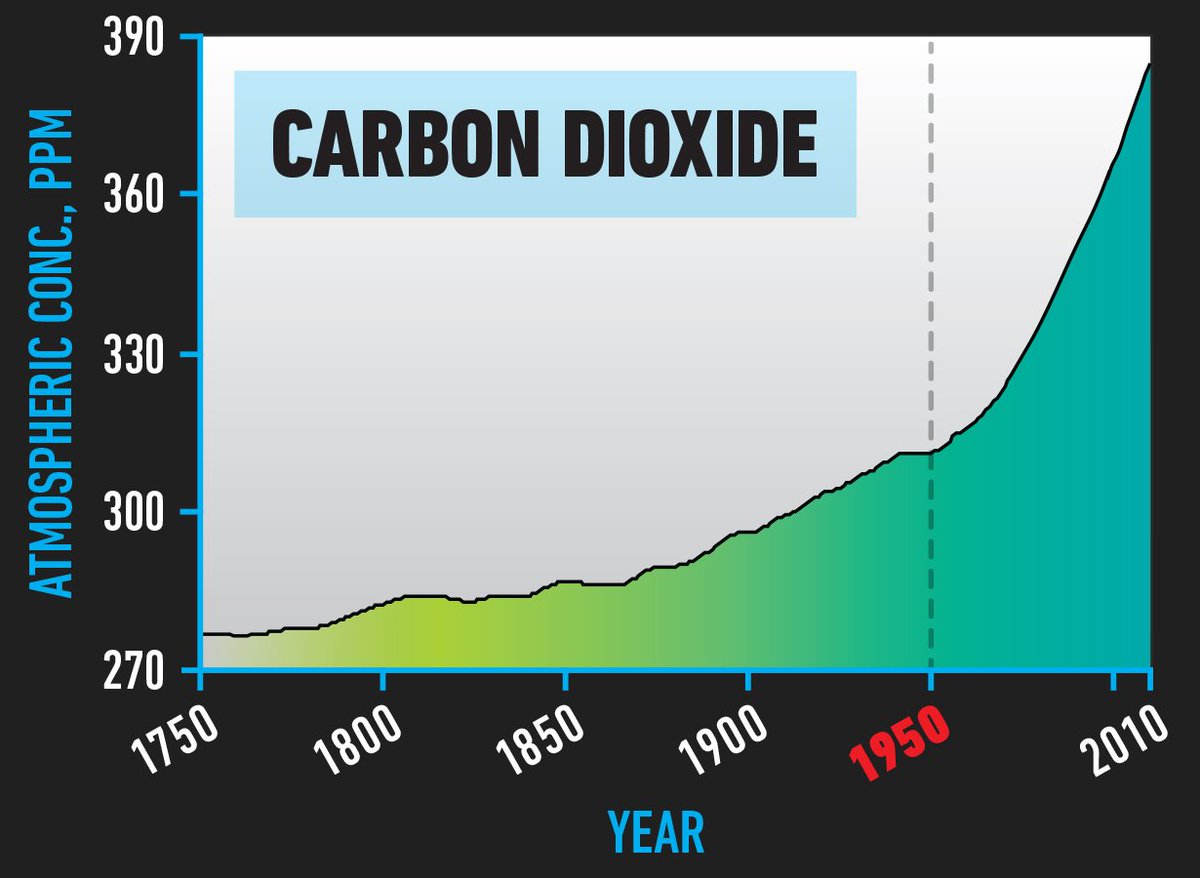
First, CO2.
Factories, cars, trucks, ships and forest destruction have caused a near 40% increase in CO2 since 1950, taking the Earth above 400 parts per million for the first time in 4 million years.
2/
Factories, cars, trucks, ships and forest destruction have caused a near 40% increase in CO2 since 1950, taking the Earth above 400 parts per million for the first time in 4 million years.
2/
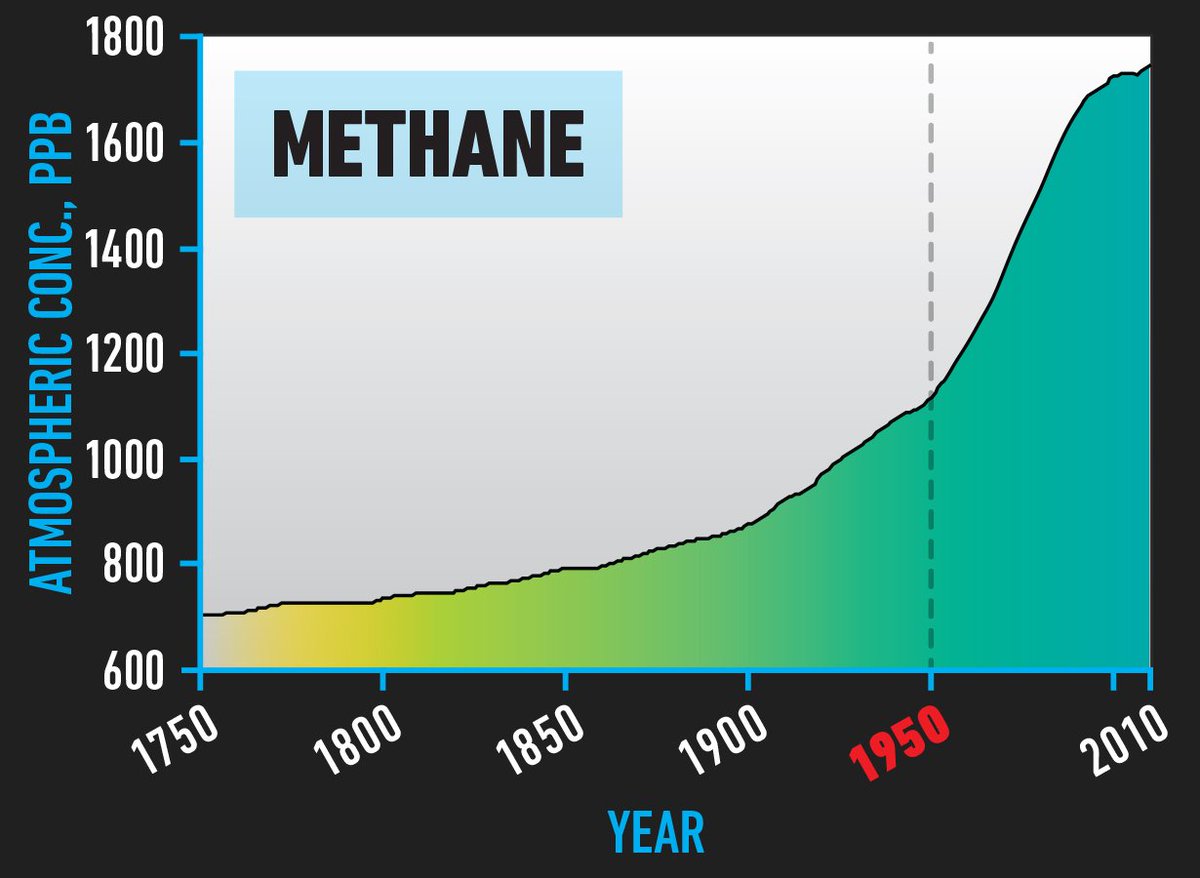
Second, methane.
Fossil fuels, agriculture, industrial processes and some natural feedbacks (including release from wetlands and permafrost) have caused a 70% increase in methane levels since 1950. The heat trapping impact of methane is *25 times* greater than CO2.
3/
Fossil fuels, agriculture, industrial processes and some natural feedbacks (including release from wetlands and permafrost) have caused a 70% increase in methane levels since 1950. The heat trapping impact of methane is *25 times* greater than CO2.
3/
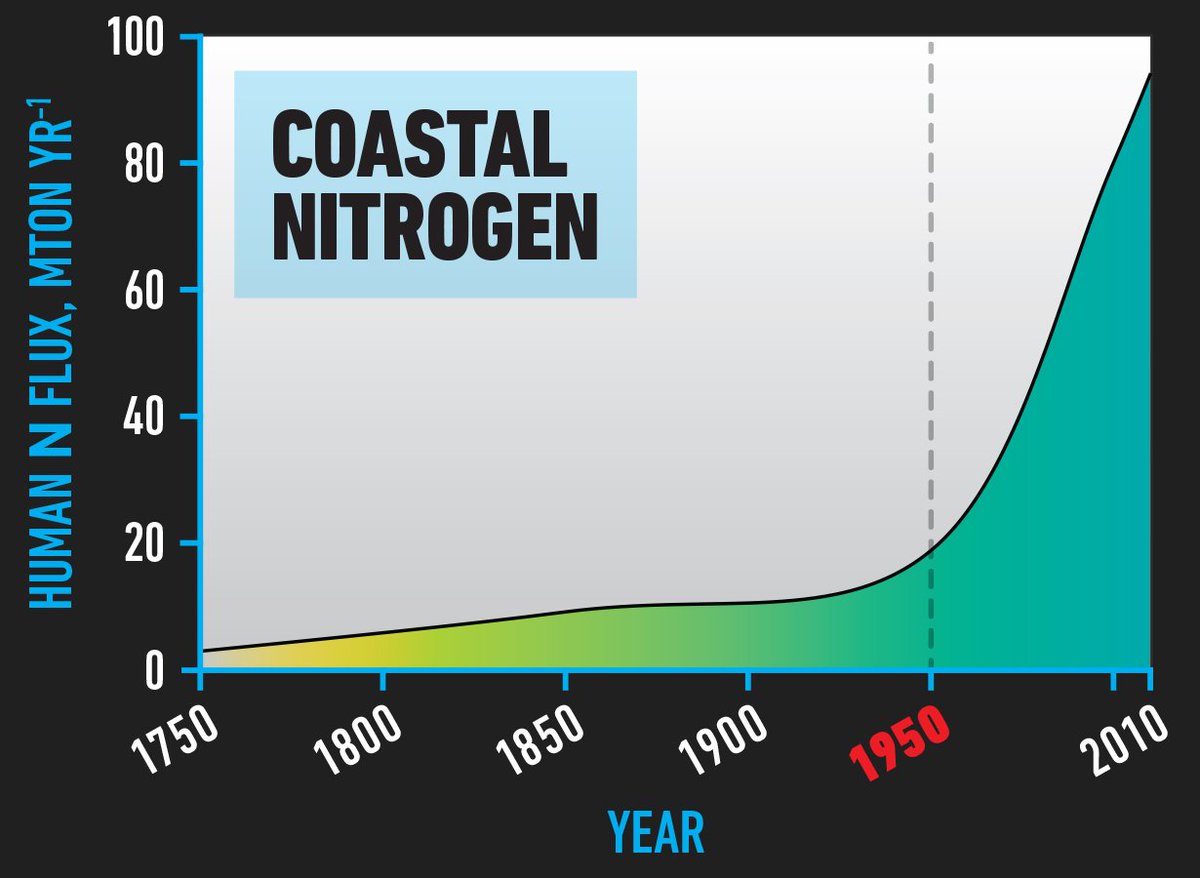
Third, coastal nitrogen.
A massive increase in synthetic nitrogen fertiliser (made from fossil fuel by-products) for agriculture, particularly meat production, has caused a 400% increase in coastal nitrogen from <20 mega tonnes to ~100 MT every year, depleting ocean oxygen.
4/
A massive increase in synthetic nitrogen fertiliser (made from fossil fuel by-products) for agriculture, particularly meat production, has caused a 400% increase in coastal nitrogen from <20 mega tonnes to ~100 MT every year, depleting ocean oxygen.
4/
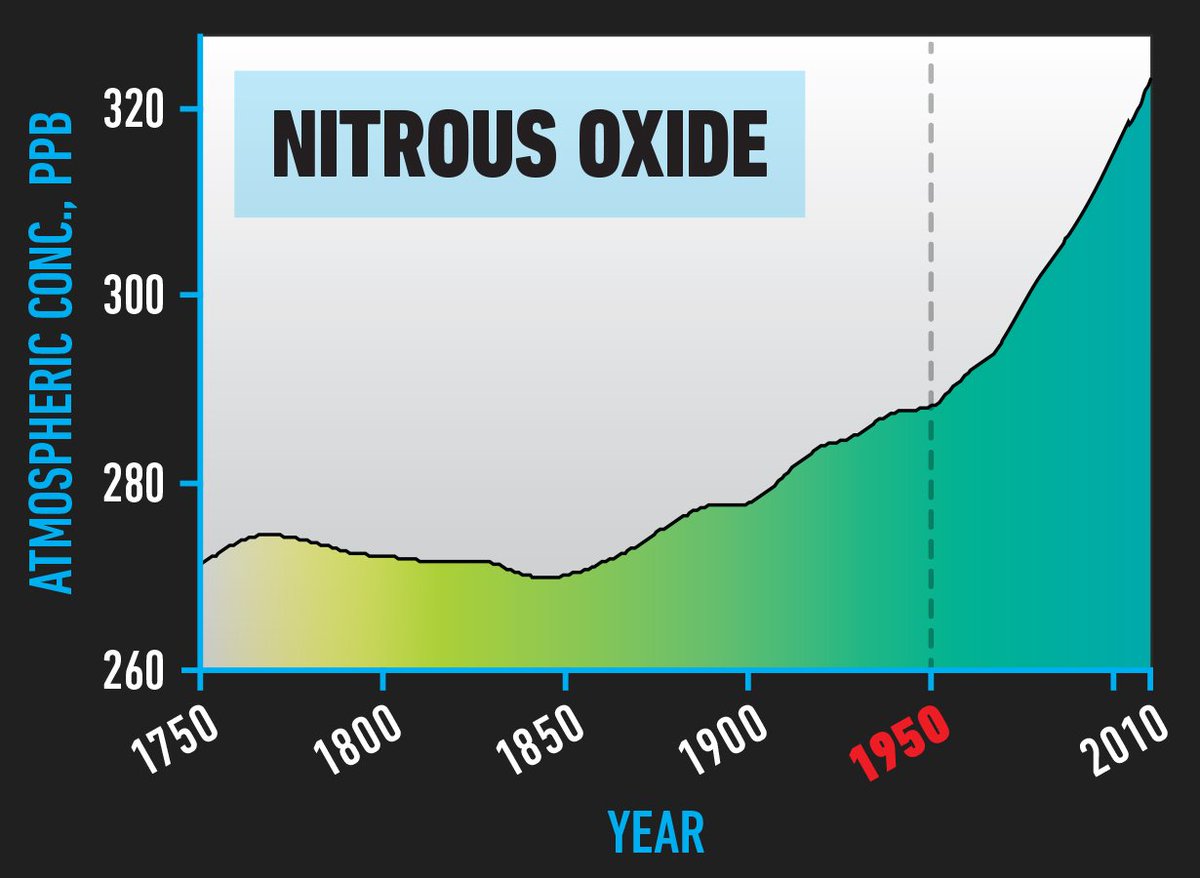
Fourth, nitrous oxide.
Related to coastal nitrogen, nitrous oxide is the gas produced from using nitrogen-based fertilisers. This has increased 15% since 1950. 60% of all synthetic fertiliser *ever used* has been used in just the last 20 years.
5/
Related to coastal nitrogen, nitrous oxide is the gas produced from using nitrogen-based fertilisers. This has increased 15% since 1950. 60% of all synthetic fertiliser *ever used* has been used in just the last 20 years.
5/
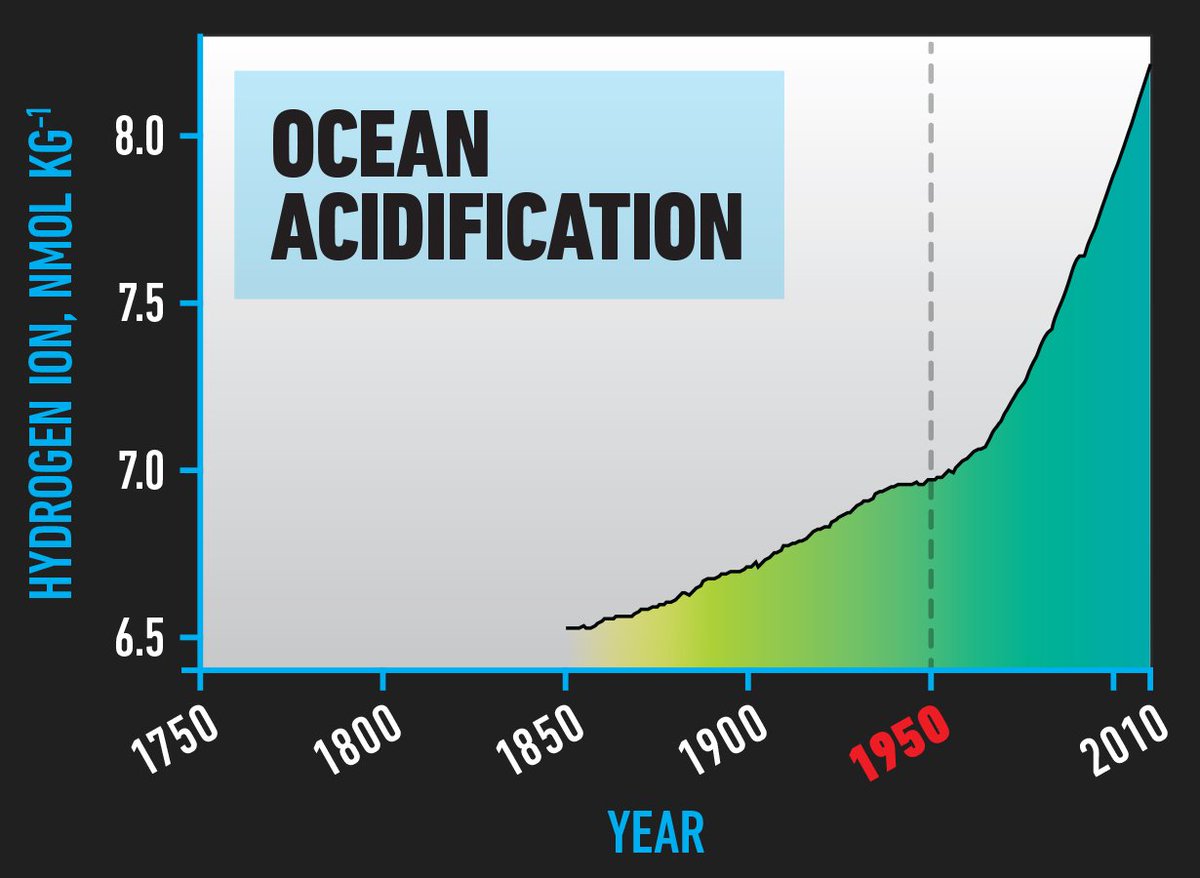
Fifth, ocean hydrogen ions.
CO2 dissolving in the oceans is increasing hydrogen ions and causing acidification (in fact a lowering of pH) which is acidifying the oceans. Ocean acidification is forecast to kill almost every coral reef on the planet within 29 years.
6/
CO2 dissolving in the oceans is increasing hydrogen ions and causing acidification (in fact a lowering of pH) which is acidifying the oceans. Ocean acidification is forecast to kill almost every coral reef on the planet within 29 years.
6/
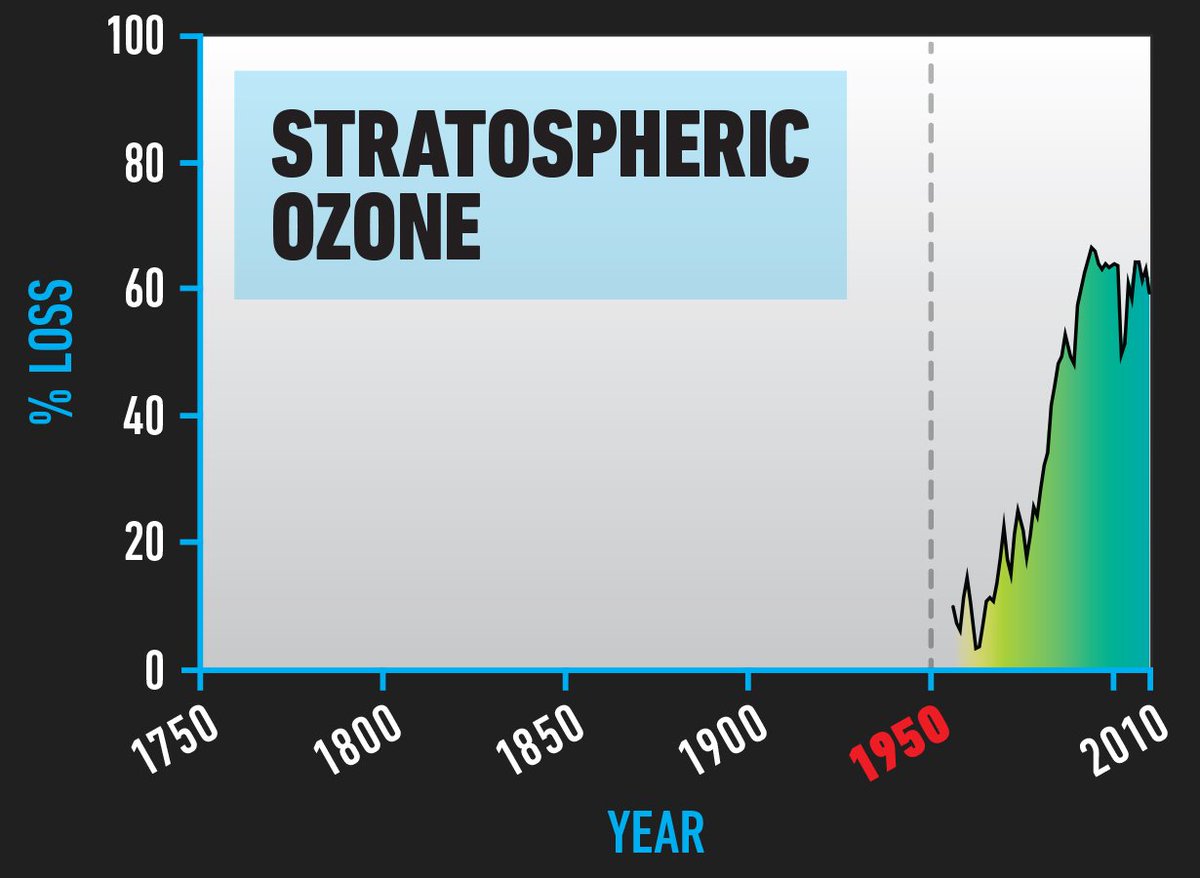
Sixth, stratospheric ozone.
The ozone layer enables life on Earth by shielding it from UV radiation. More than 60% of the ozone layer was destroyed by manufactured chemicals, principally CFCs used in refrigeration. Without action, life on Earth would have ended.
7/
The ozone layer enables life on Earth by shielding it from UV radiation. More than 60% of the ozone layer was destroyed by manufactured chemicals, principally CFCs used in refrigeration. Without action, life on Earth would have ended.
7/
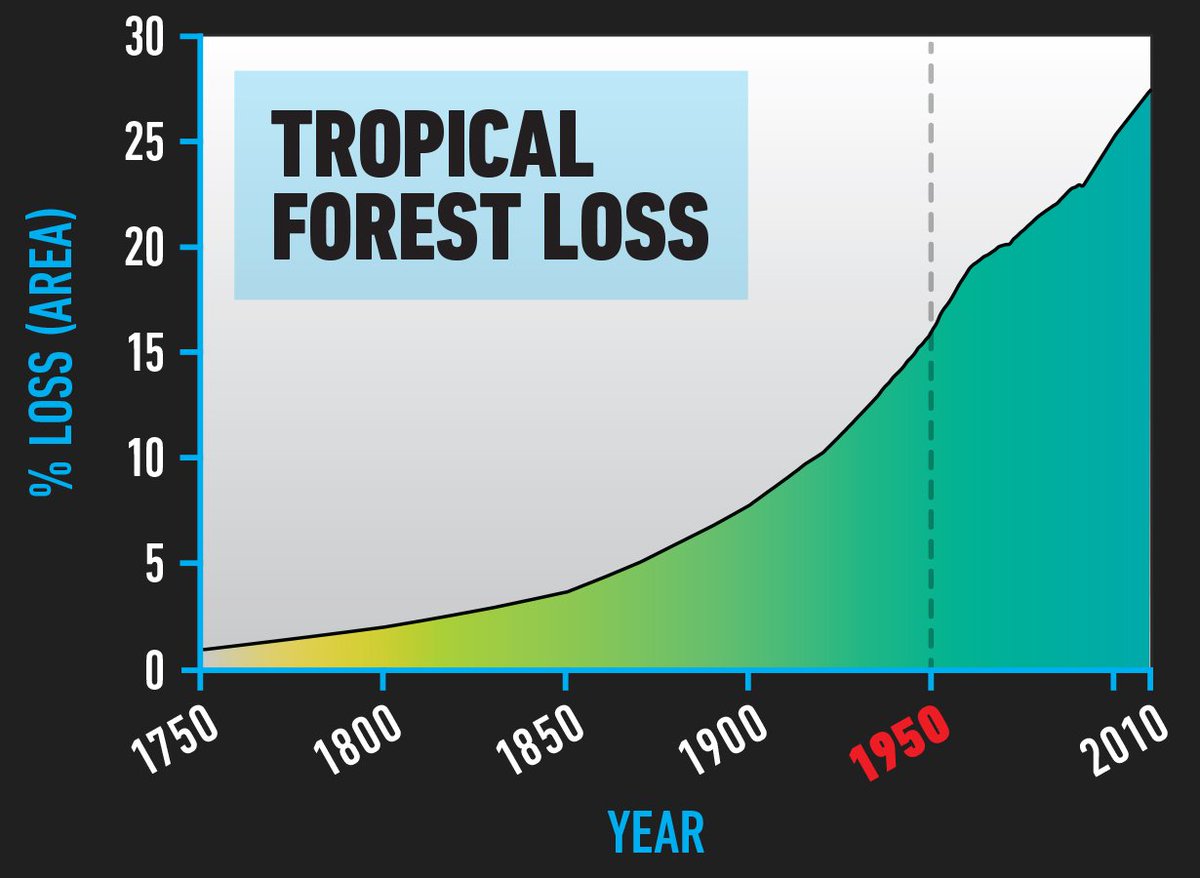
Seventh, tropical forest destruction.
Nearing 30% of the world’s tropical forests have been destroyed, a doubling on 1950 levels. Tropical forests generate rain, regulate climate and are home to millions of species.
8/
Nearing 30% of the world’s tropical forests have been destroyed, a doubling on 1950 levels. Tropical forests generate rain, regulate climate and are home to millions of species.
8/
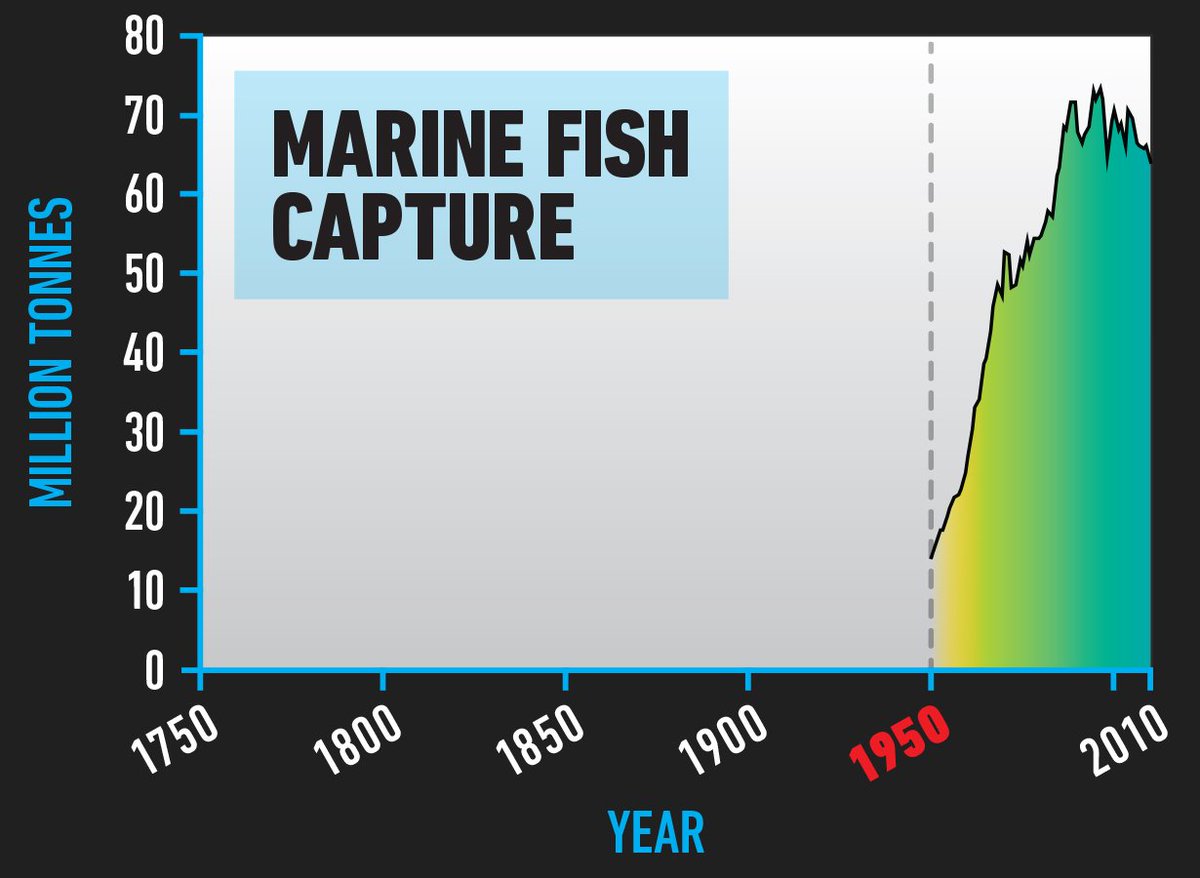
Eighth, fish capture.
From under 15 million tonnes to a peak of over 70 million tonnes, the amount of fish hauled from the seas increased 360% since 1950. It has slowed because of over-fishing. Success!
9/
From under 15 million tonnes to a peak of over 70 million tonnes, the amount of fish hauled from the seas increased 360% since 1950. It has slowed because of over-fishing. Success!
9/
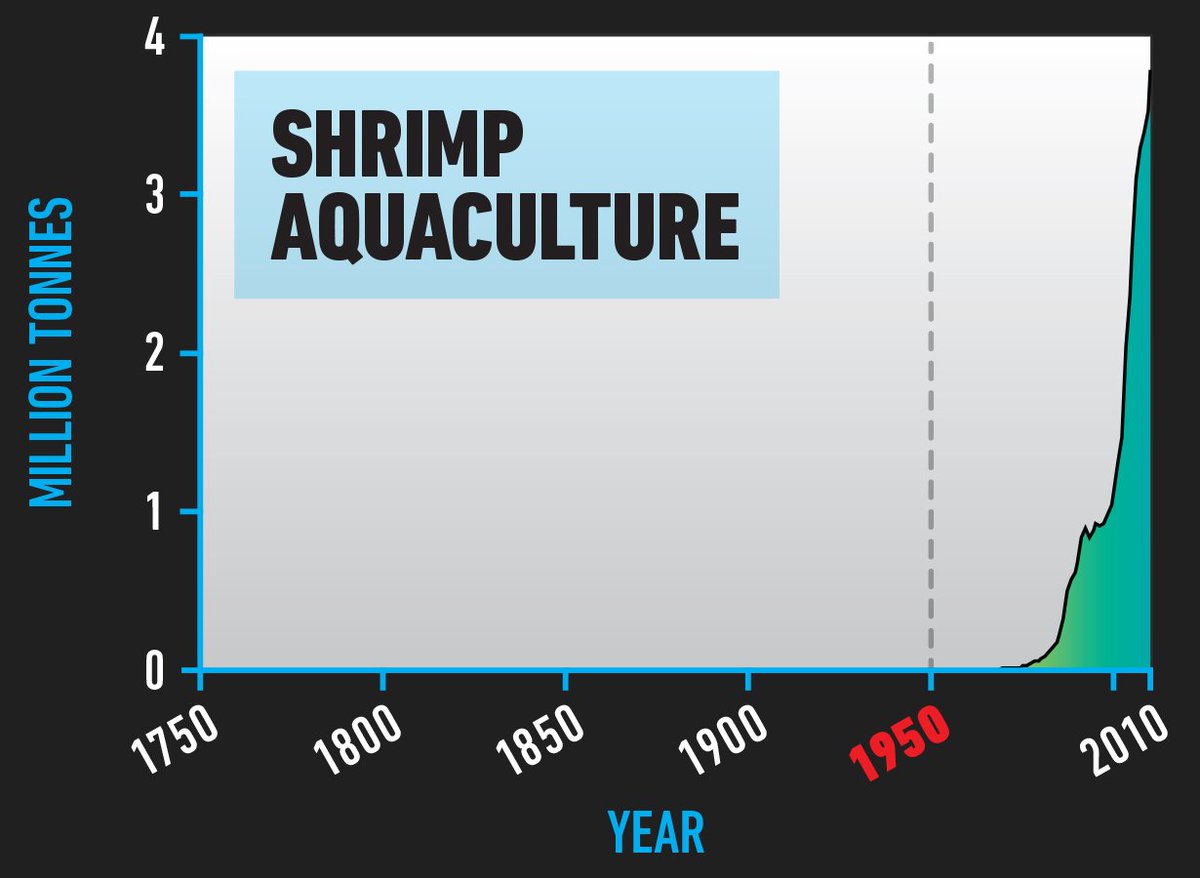
Ninth, shrimp aquaculture.
From nothing, to 4 million tonnes farmed every year. Mangroves (huge carbon stores) have been cleared for shrimp farms that produce waste, chemicals and antibiotics, and breed diseases that seabirds spread around.
10/
From nothing, to 4 million tonnes farmed every year. Mangroves (huge carbon stores) have been cleared for shrimp farms that produce waste, chemicals and antibiotics, and breed diseases that seabirds spread around.
10/
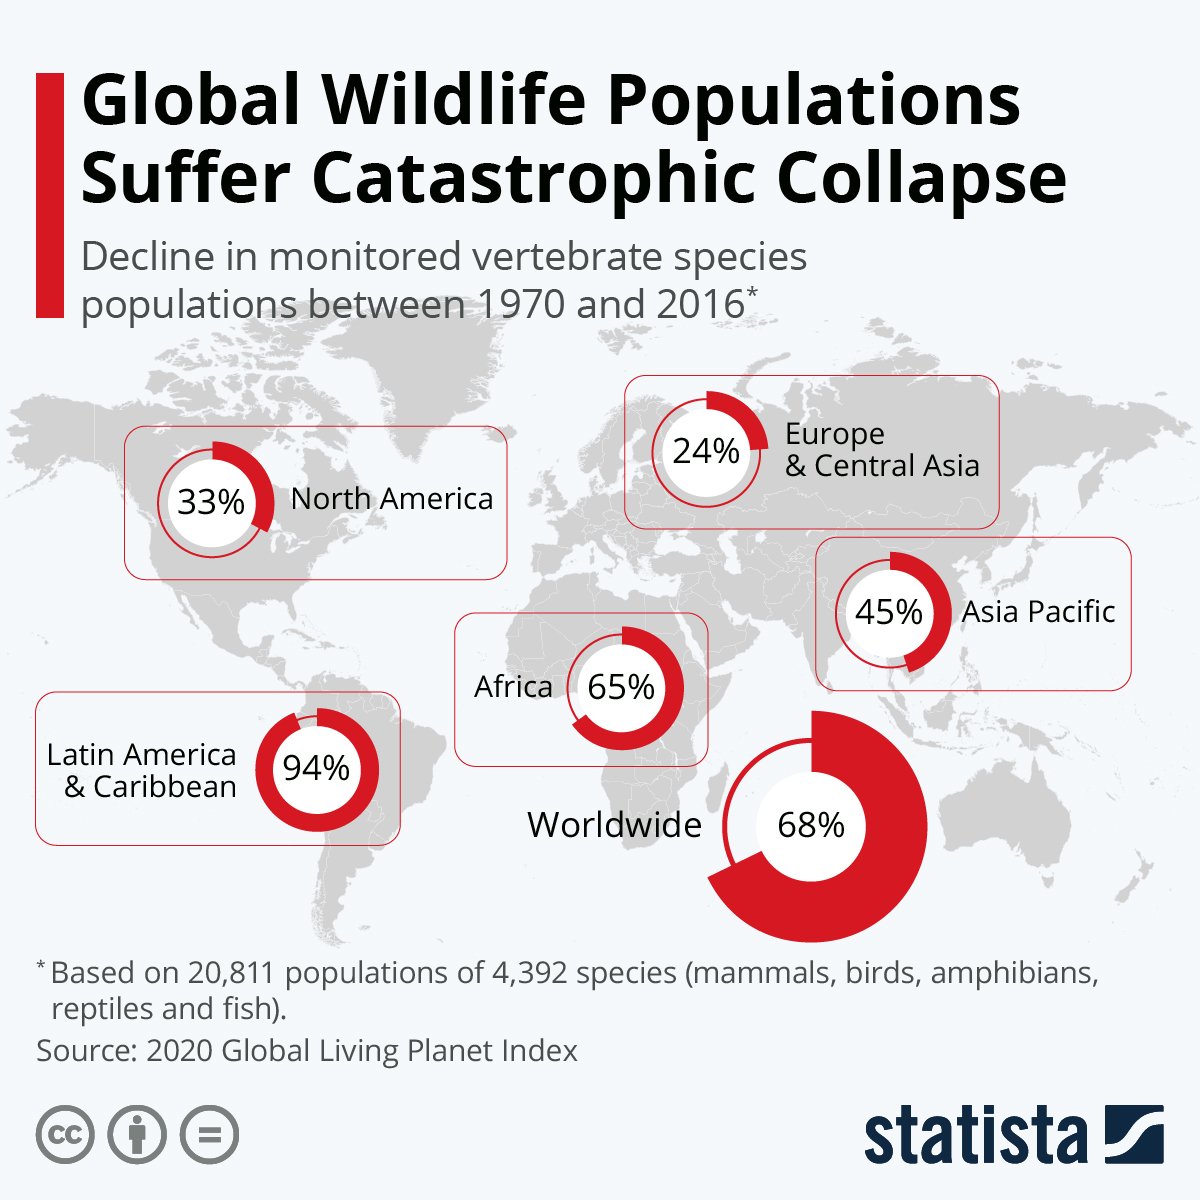
Tenth, wildlife death.
Economic system activity is killing life on Earth, with a 68% average decline in global vertebrate species populations between 1970 and 2016.
11/
Economic system activity is killing life on Earth, with a 68% average decline in global vertebrate species populations between 1970 and 2016.
11/
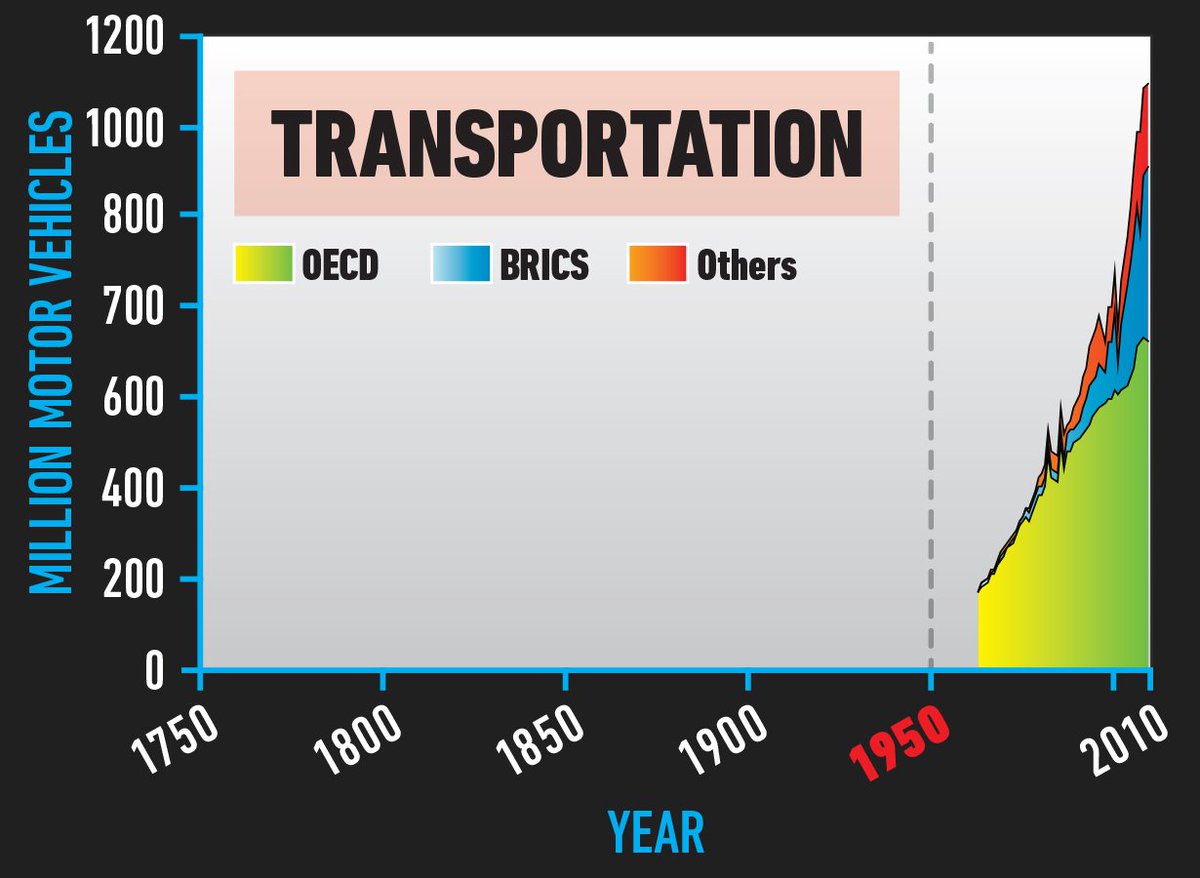
Eleventh, motor vehicles.
From perhaps 50 million motor vehicles in 1950, there are now 1.2 billion vehicles on Earth, forecast to increase to 2 billion by 2035, with the attendant destruction of nature for roads this entails.
12/
From perhaps 50 million motor vehicles in 1950, there are now 1.2 billion vehicles on Earth, forecast to increase to 2 billion by 2035, with the attendant destruction of nature for roads this entails.
12/
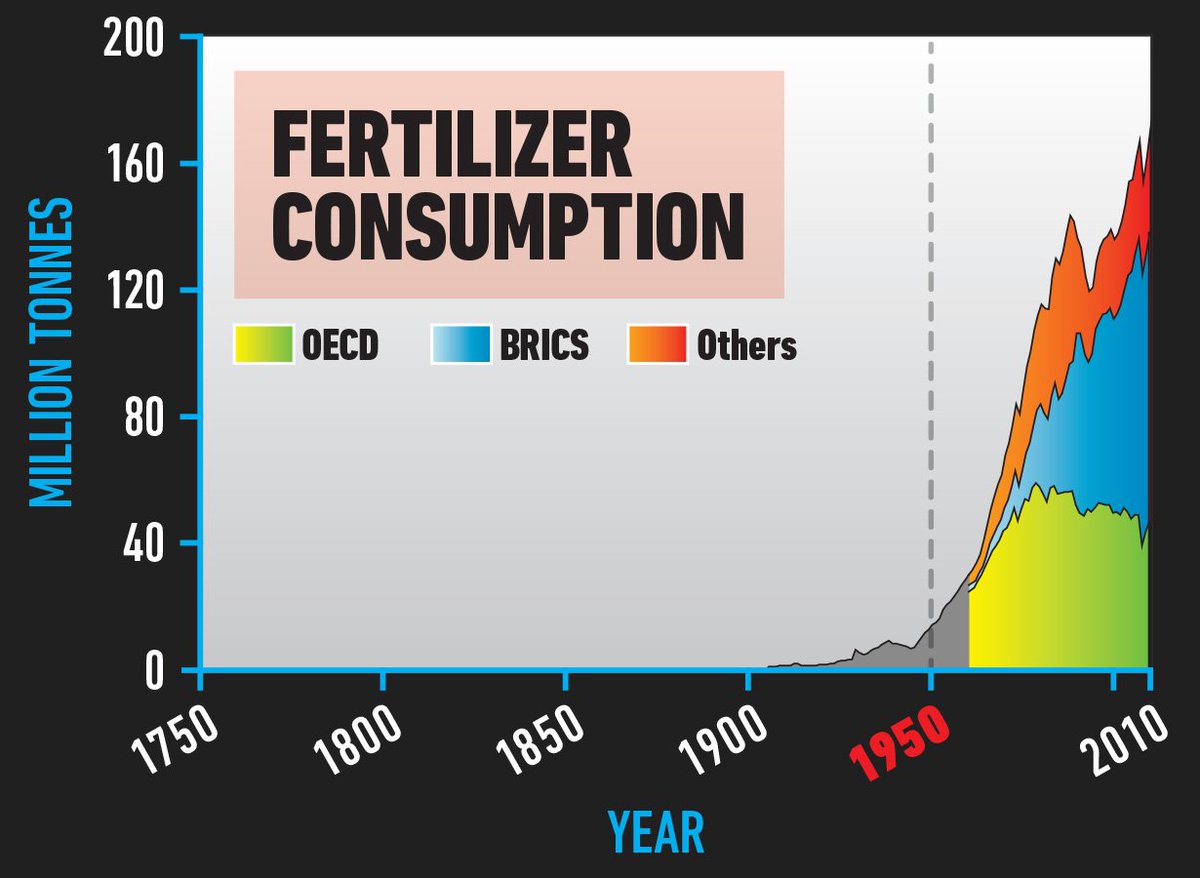
Twelfth, fertiliser consumption.
Back to our old friend. Synthetic fertiliser production has increased from 10 million tonnes in 1950 to over 160 million tonnes.
13/
Back to our old friend. Synthetic fertiliser production has increased from 10 million tonnes in 1950 to over 160 million tonnes.
13/
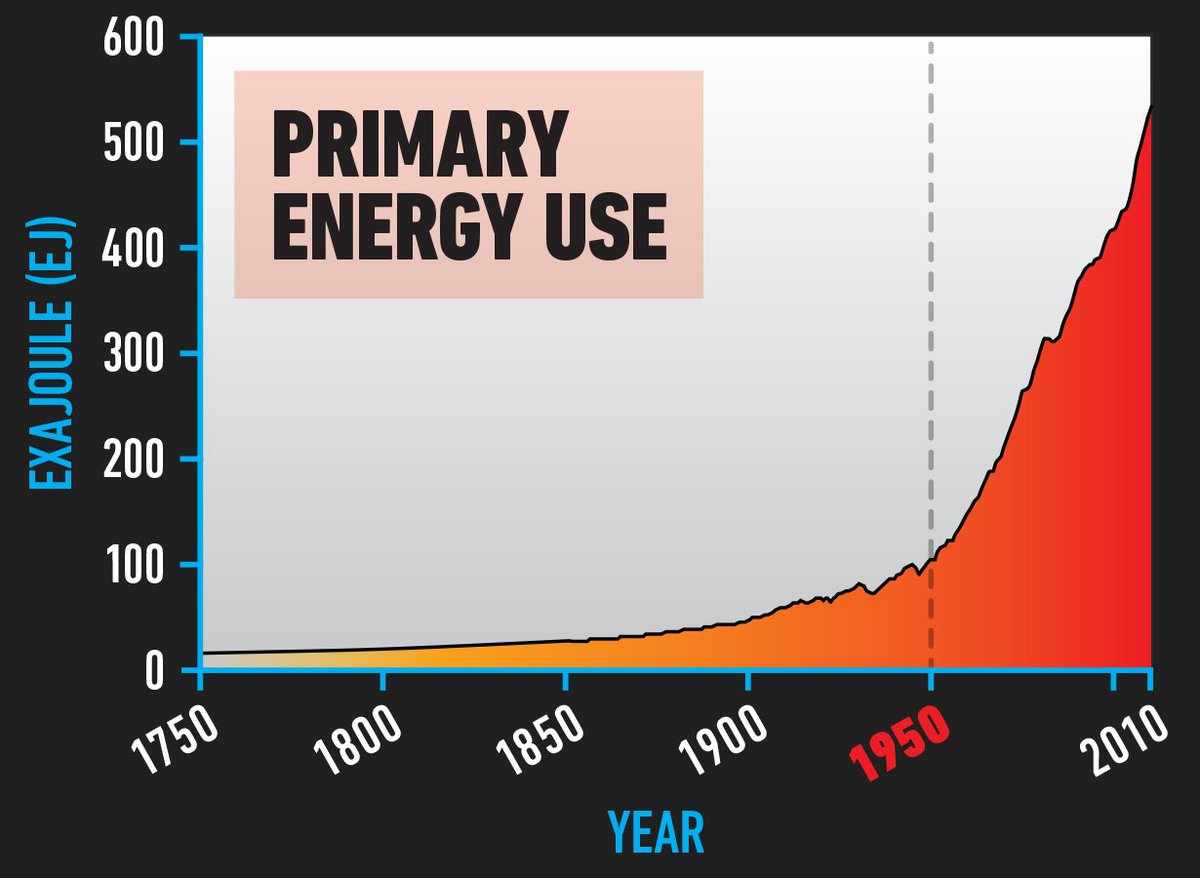
Thirteenth, primary energy use.
From under 100 exajoules in 1950, primary global energy use has increased to 576 EJs in 2019, a nearly 500% increase. The increase since just the year 2000 has been almost 200 exajoules.
14/
From under 100 exajoules in 1950, primary global energy use has increased to 576 EJs in 2019, a nearly 500% increase. The increase since just the year 2000 has been almost 200 exajoules.
14/
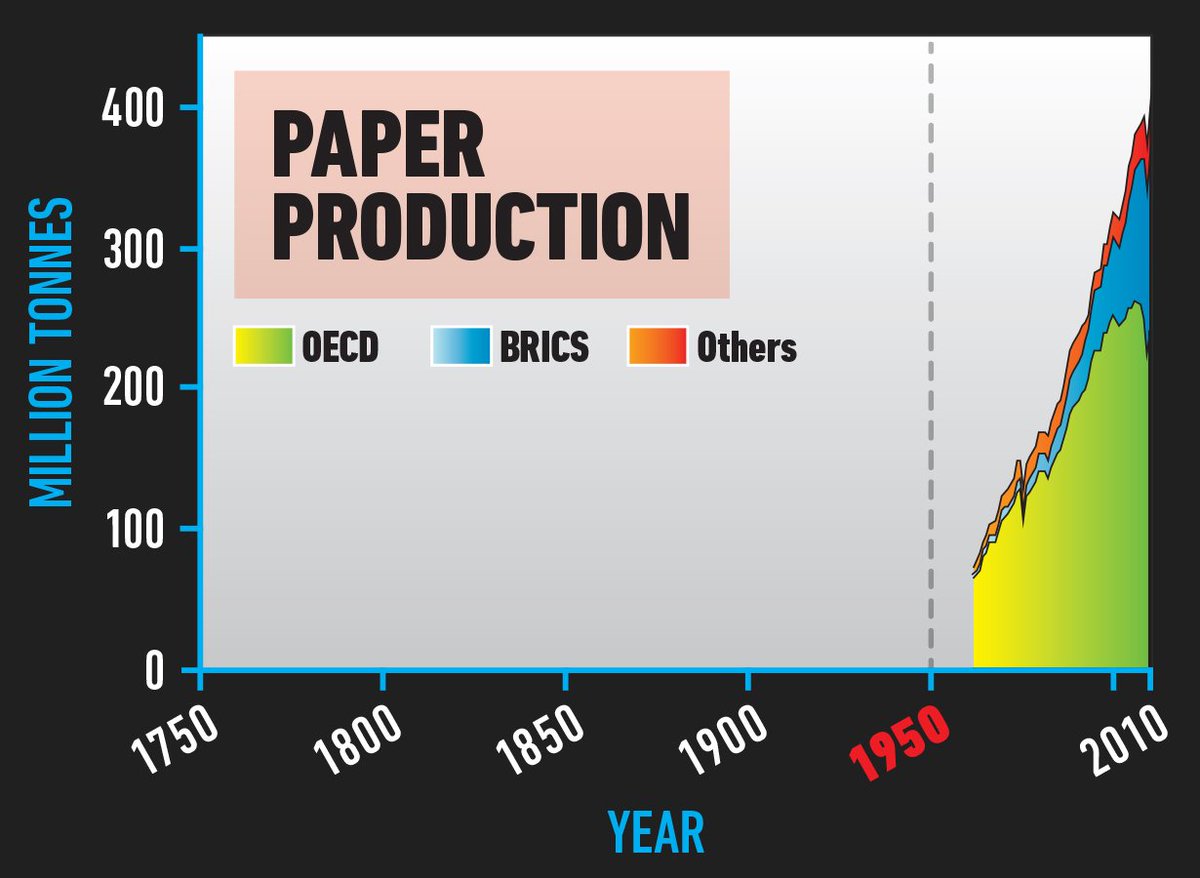
Fourteenth, paper production.
From perhaps 50 million tonnes in 1950 to almost 400 million tonnes today, a 700% increase. Paper production is responsible for some of the world’s most biodiverse habitat being wiped out in Indonesia.
15/
From perhaps 50 million tonnes in 1950 to almost 400 million tonnes today, a 700% increase. Paper production is responsible for some of the world’s most biodiverse habitat being wiped out in Indonesia.
15/
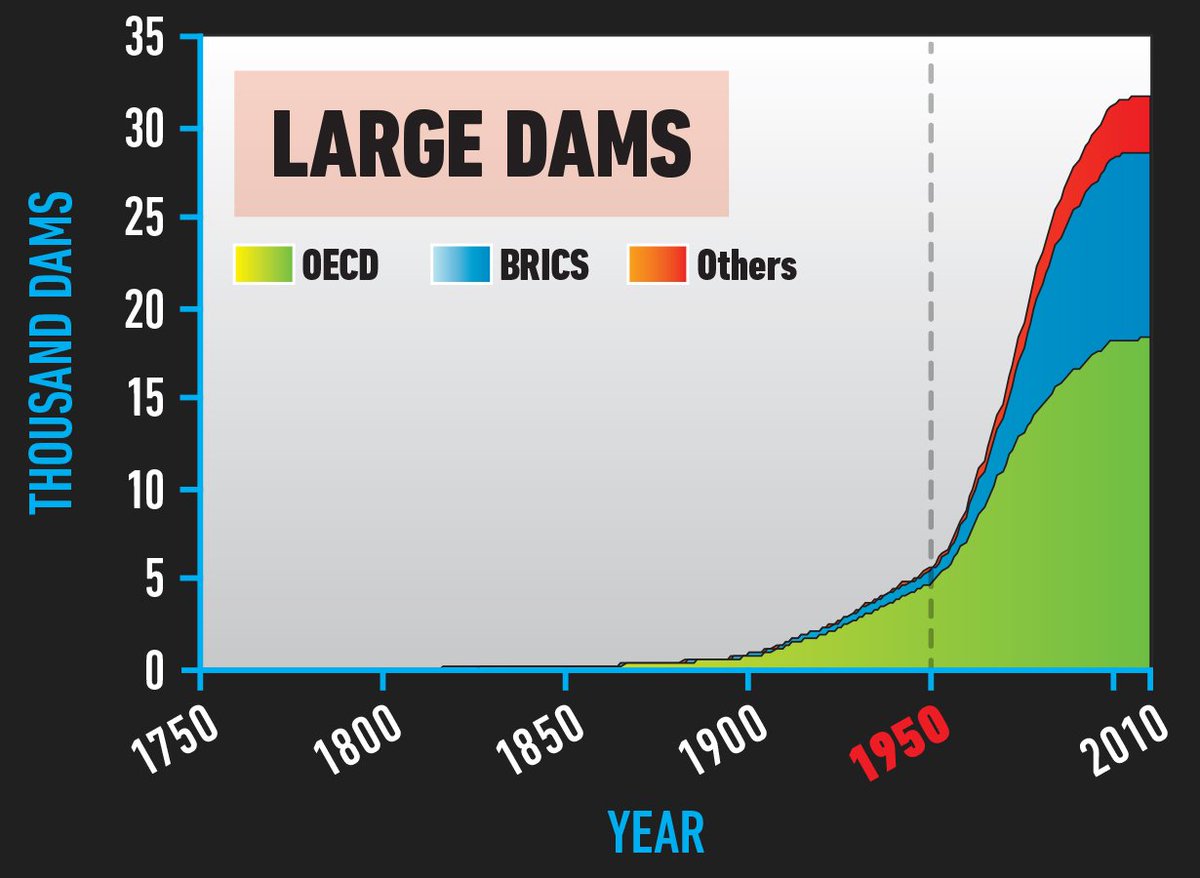
Fifteenth, dams.
From under 5,000 large dams in 1950 to more than 30,000 today. Dams alter river ecosystems, kill wildlife and when upstream forests are flooded their carbon storage functions are eliminated and rotting plants release methane.
16/
From under 5,000 large dams in 1950 to more than 30,000 today. Dams alter river ecosystems, kill wildlife and when upstream forests are flooded their carbon storage functions are eliminated and rotting plants release methane.
16/
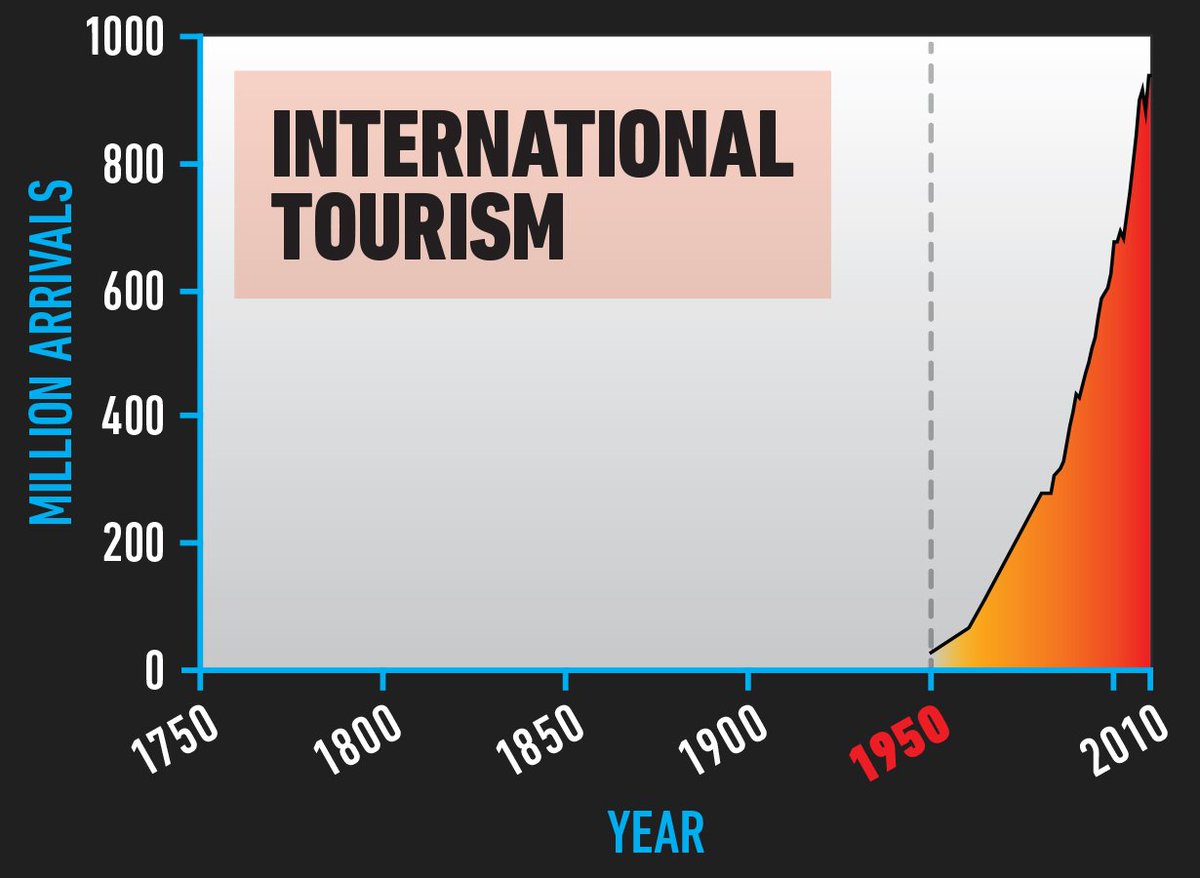
Sixteenth, international tourism.
On the busiest days pre-covid, there were up to 225,000 planes in the air *at the same time*.
17/
On the busiest days pre-covid, there were up to 225,000 planes in the air *at the same time*.
17/
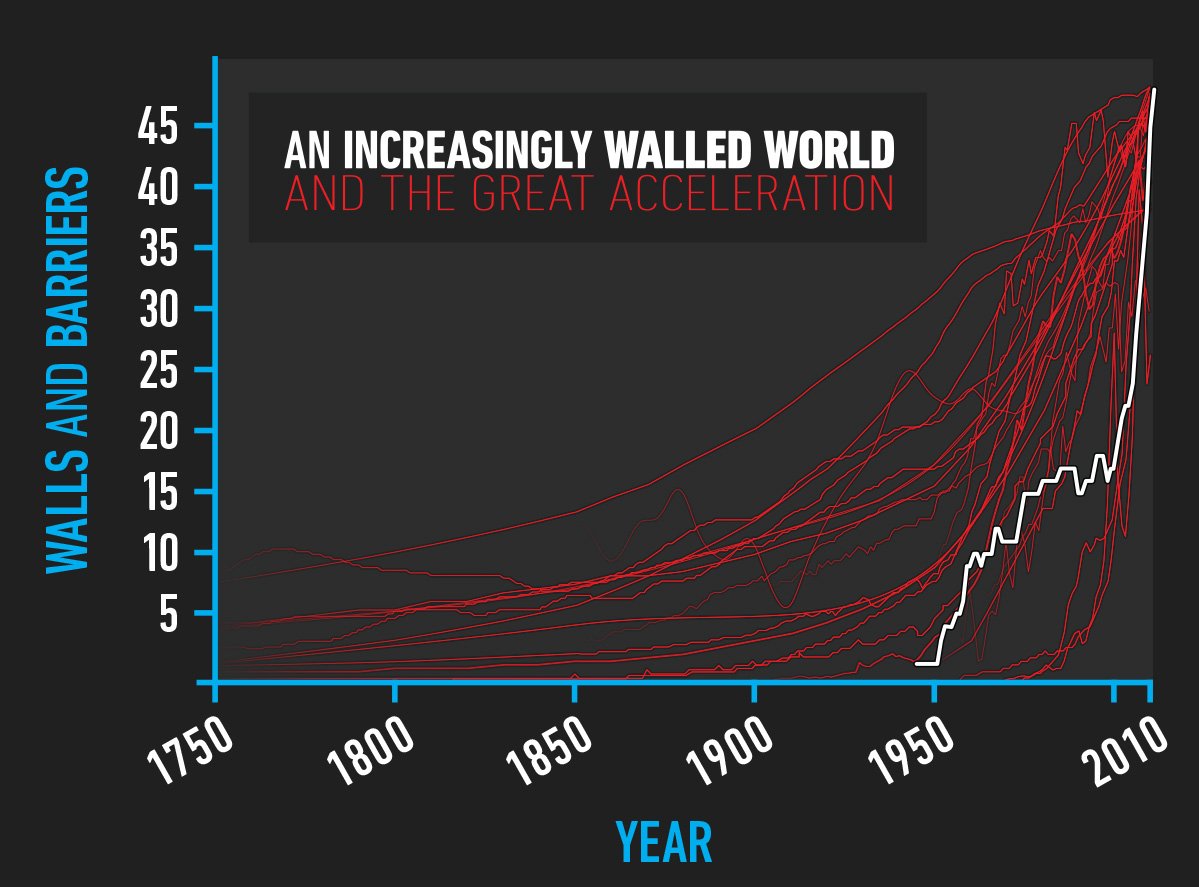
Seventeenth, border walls.
As the world is being pummelled, so are its people. 60% of people in the world now live in a country that has built a border wall.
18/
As the world is being pummelled, so are its people. 60% of people in the world now live in a country that has built a border wall.
18/
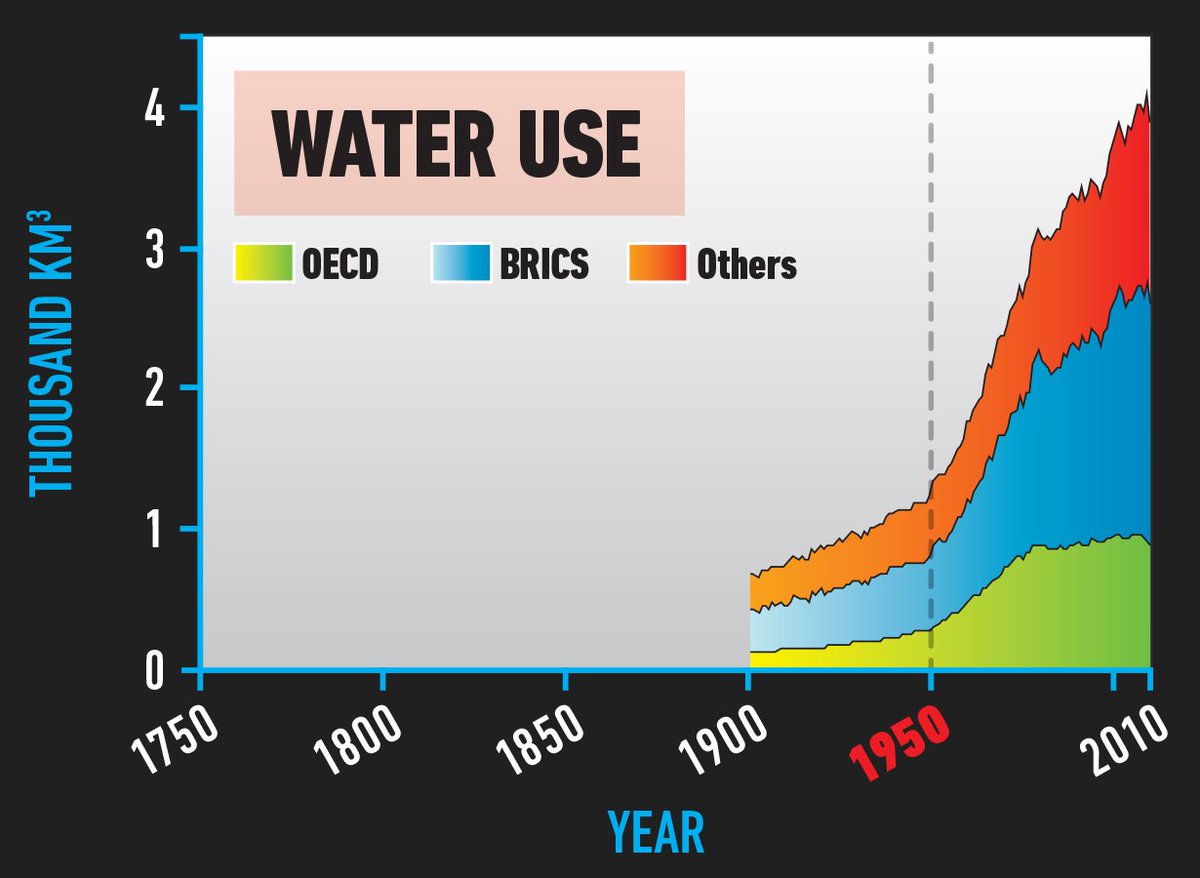
Eighteenth, water use.
From around 1,000 cubic kilometres of freshwater used every year to around 4,000. We are running out of water.
19/
From around 1,000 cubic kilometres of freshwater used every year to around 4,000. We are running out of water.
19/
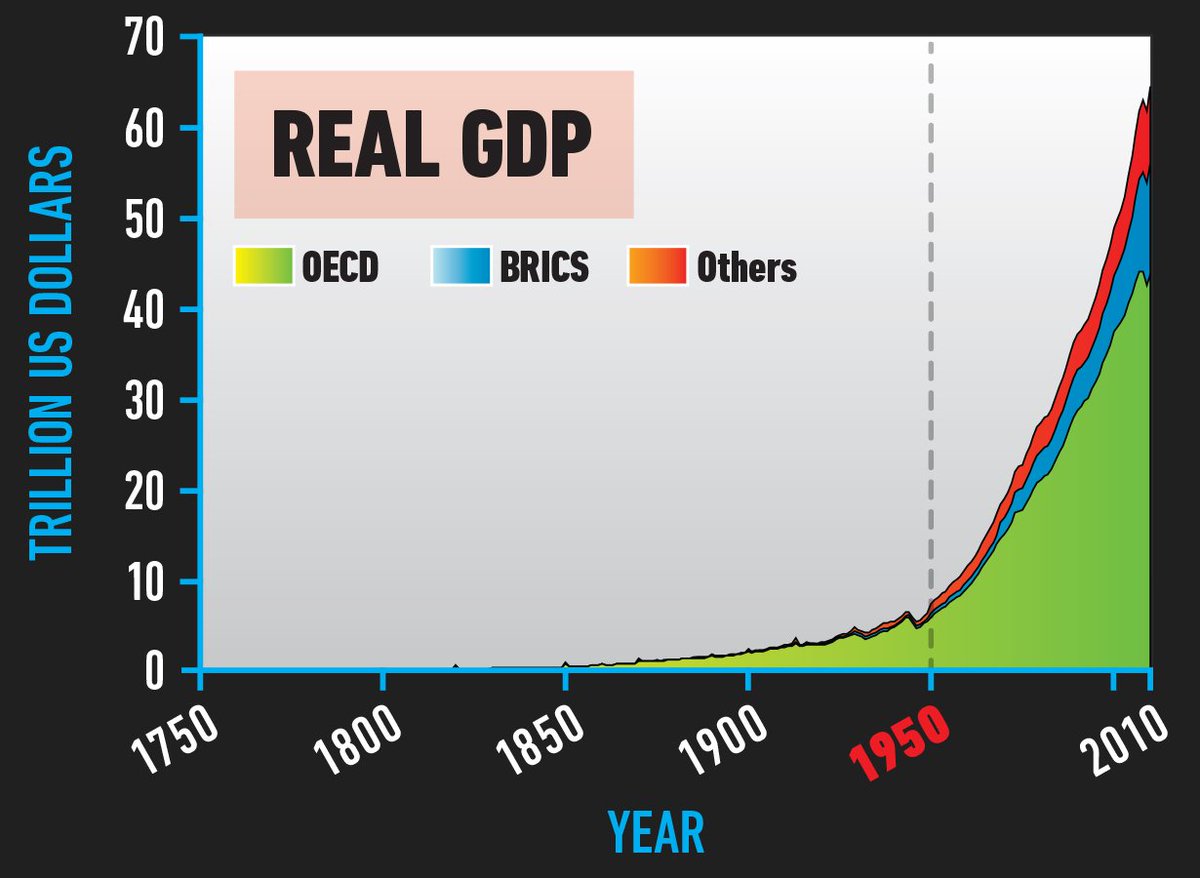
Nineteenth, GDP.
Some economists and scientists don’t want you to think any of this is connected to economic growth, but this chart speaks for itself. Life on Earth is being sacrificed for the astonishing wealth of a few.
We need a new system. Soon.
20/
Some economists and scientists don’t want you to think any of this is connected to economic growth, but this chart speaks for itself. Life on Earth is being sacrificed for the astonishing wealth of a few.
We need a new system. Soon.
20/
• • •
Missing some Tweet in this thread? You can try to
force a refresh


