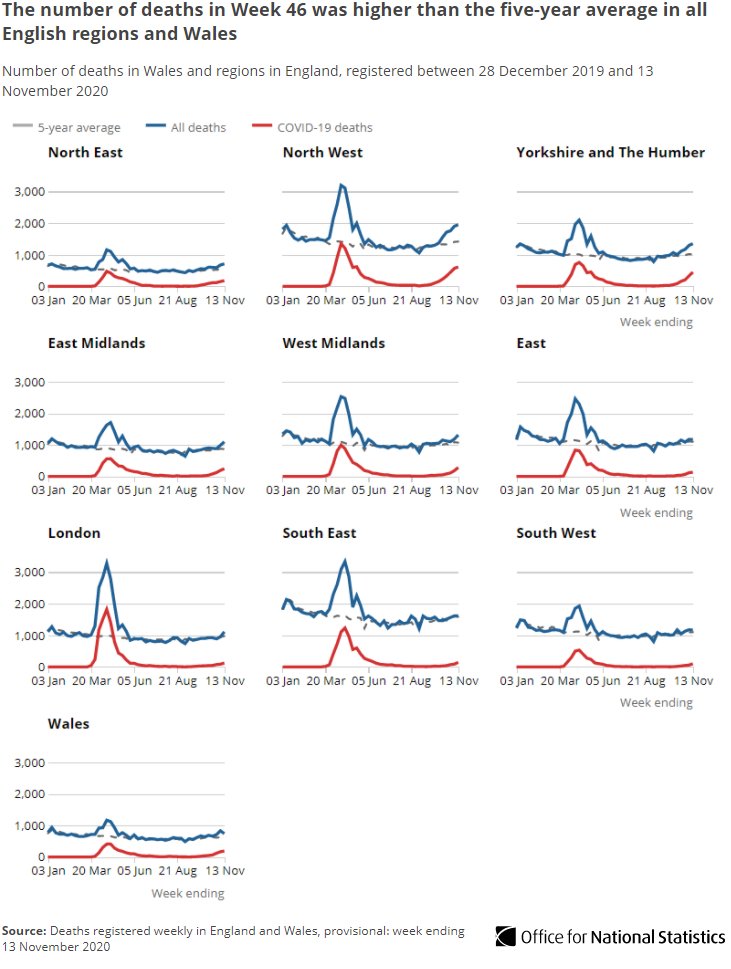
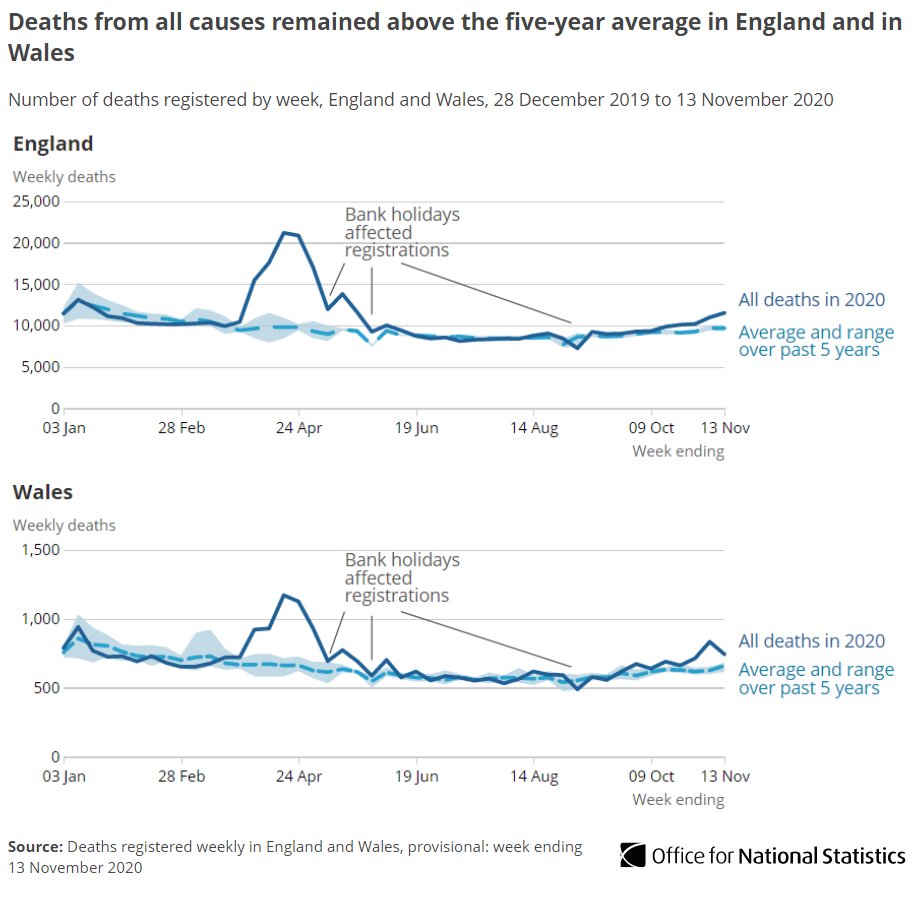
The provisional number of deaths registered in England and Wales in the week ending 13 November 2020 (Week 46) was 12,254.

This was

▪️ 442 more than Week 45
▪️ 1,904 more than the five-year average for Week 46

➡️ow.ly/jY8A50Ct7ah Chart title: Deaths from al...
Of the 12,254 deaths registered in Week 46, 2,466 mention #COVID19 on the death certificate (20.1% of all deaths).

This has risen by 529 #COVID19 deaths since the previous week (Week 45) ow.ly/KYOo50Ct7ff Chart title: The number of ...
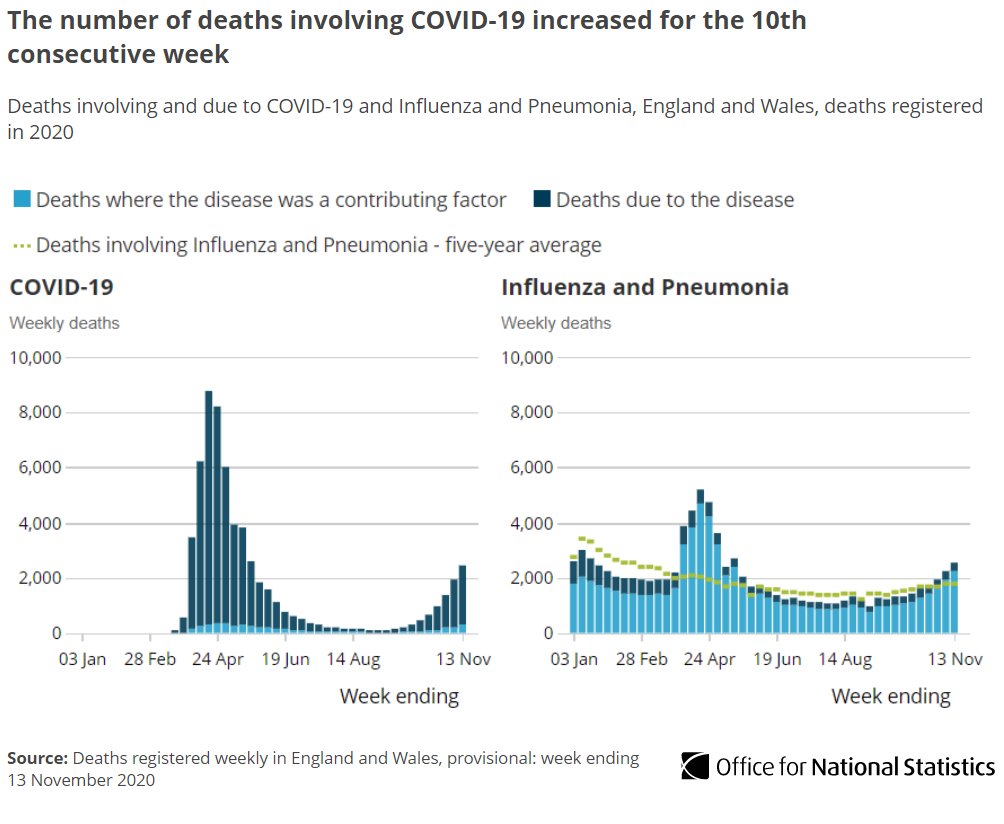
Of the 2,366 deaths involving #COVID19, 88% had this recorded as the underlying cause of death.

Of the 2,537 deaths involving influenza and pneumonia, 11.5% had these as the underlying cause ow.ly/k2Zj50Ct7lK
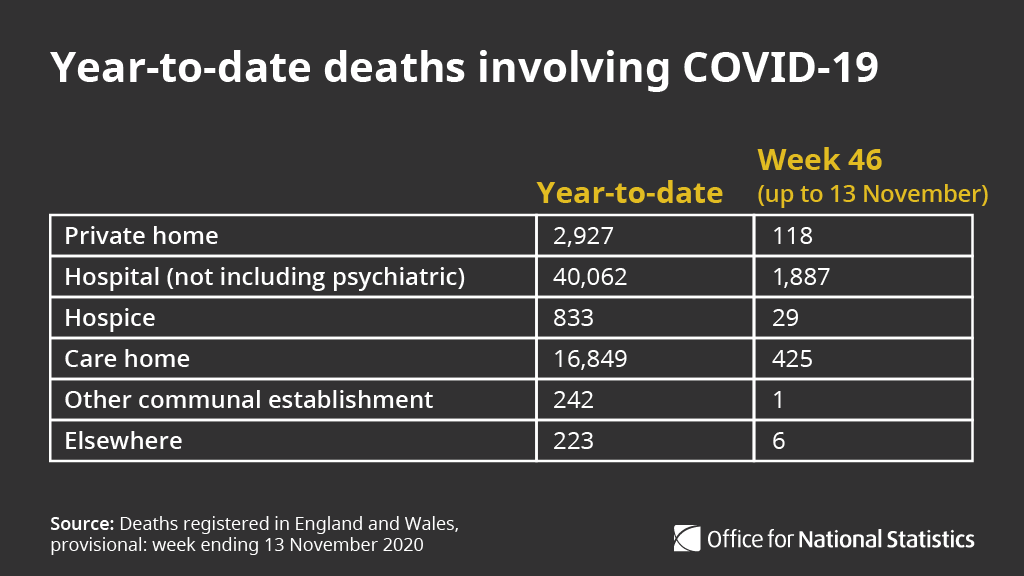
Of deaths involving #COVID19 registered up to Week 46, 40,062 deaths (65.5%) occurred in hospitals. The remainder mainly occurred in

▪️ care homes (16,849)
▪️ private homes (2,927)
▪️ hospices (833)

➡️ow.ly/ZiPU50Ct7qh Graphic table text: Year-to...
The number of deaths involving #COVID19 increased across all of the nine English regions ow.ly/XLSS50Ct7ul Chart title: The number of ...
In Wales, there were 190 deaths registered in Week 46 involving #COVID19, an increase compared with the 166 deaths registered in Week 45 ow.ly/XLSS50Ct7ul
In England, of all deaths that occurred up to 13 November (registered up 21 November), 58,753 involved #COVID19.

For the same period @DHSCgovuk reported 45,449 #COVID19 death notifications (where the death occurred within 28 days of a positive test) ow.ly/XLSS50Ct7ul
For Wales up to 13 November (registered up to 21 November), our data show 3,329 deaths involved #COVID19.

@DHSCgovuk reported 2,191 COVID-19 death notifications in this time, based on @PublicHealthW data where death occurred within 28 days of testing ow.ly/XLSS50Ct7ul
ONS figures for date of death are based on deaths registered up to 21 November and may increase as more deaths are registered.

@DHSCgovuk reports on date of notification and only include deaths reported up to 5pm the day before ow.ly/XLSS50Ct7ul

• • •

Missing some Tweet in this thread? You can try to force a refresh
 

Keep Current with Office for National Statistics (ONS)

Office for National Statistics (ONS) Profile picture

Stay in touch and get notified when new unrolls are available from this author!

Read all threads

This Thread may be Removed Anytime!

PDF

Twitter may remove this content at anytime! Save it as PDF for later use!

Try unrolling a thread yourself!

how to unroll video
  1. Follow @ThreadReaderApp to mention us!

  2. From a Twitter thread mention us with a keyword "unroll"
@threadreaderapp unroll

Practice here first or read more on our help page!

More from @ONS

26 Nov
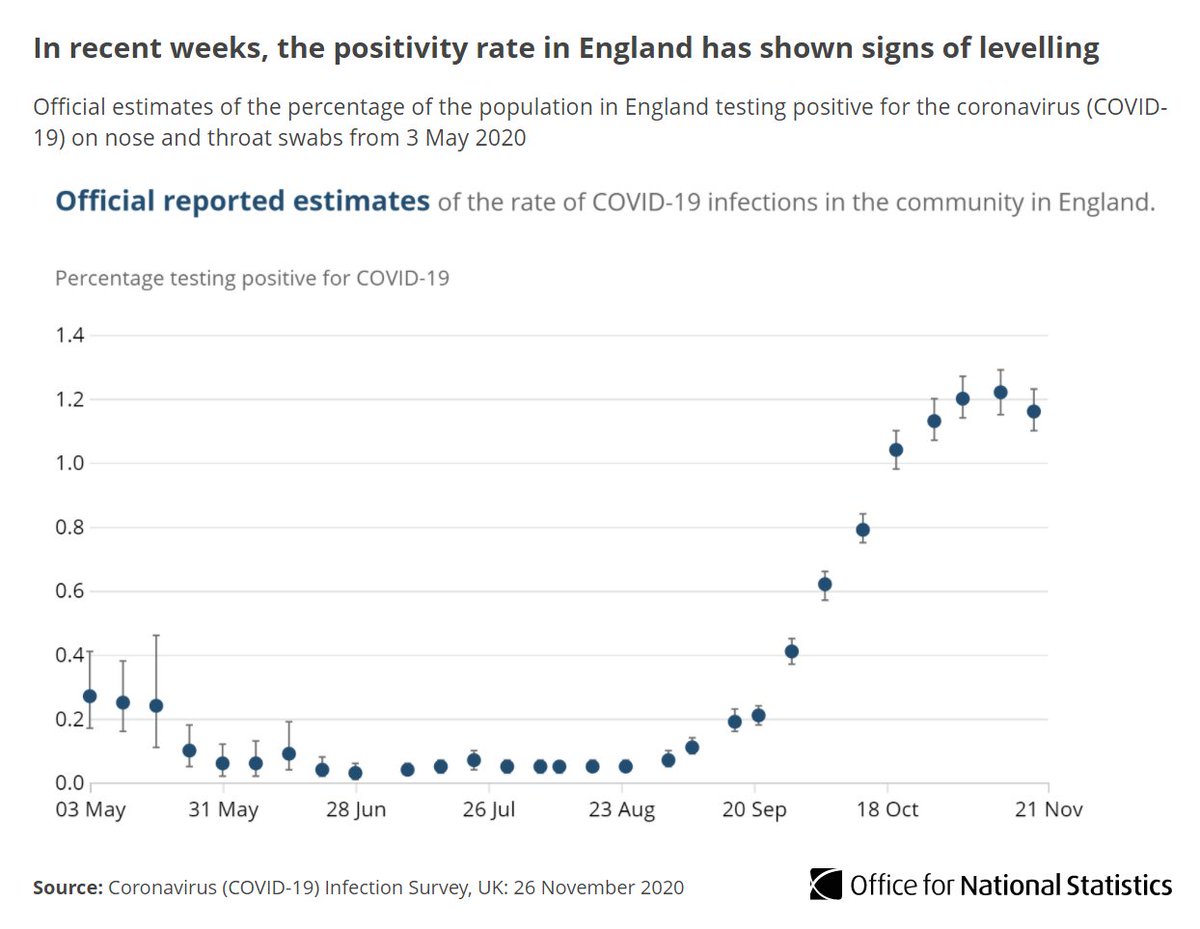
Our latest estimates for England suggest the #COVID19 infection rate may be levelling off.

Around 1 in 85 people not in care homes, hospitals or other institutional settings would test positive from 15 to 21 November ow.ly/I6nv50CvtVD Chart title: In recent week...
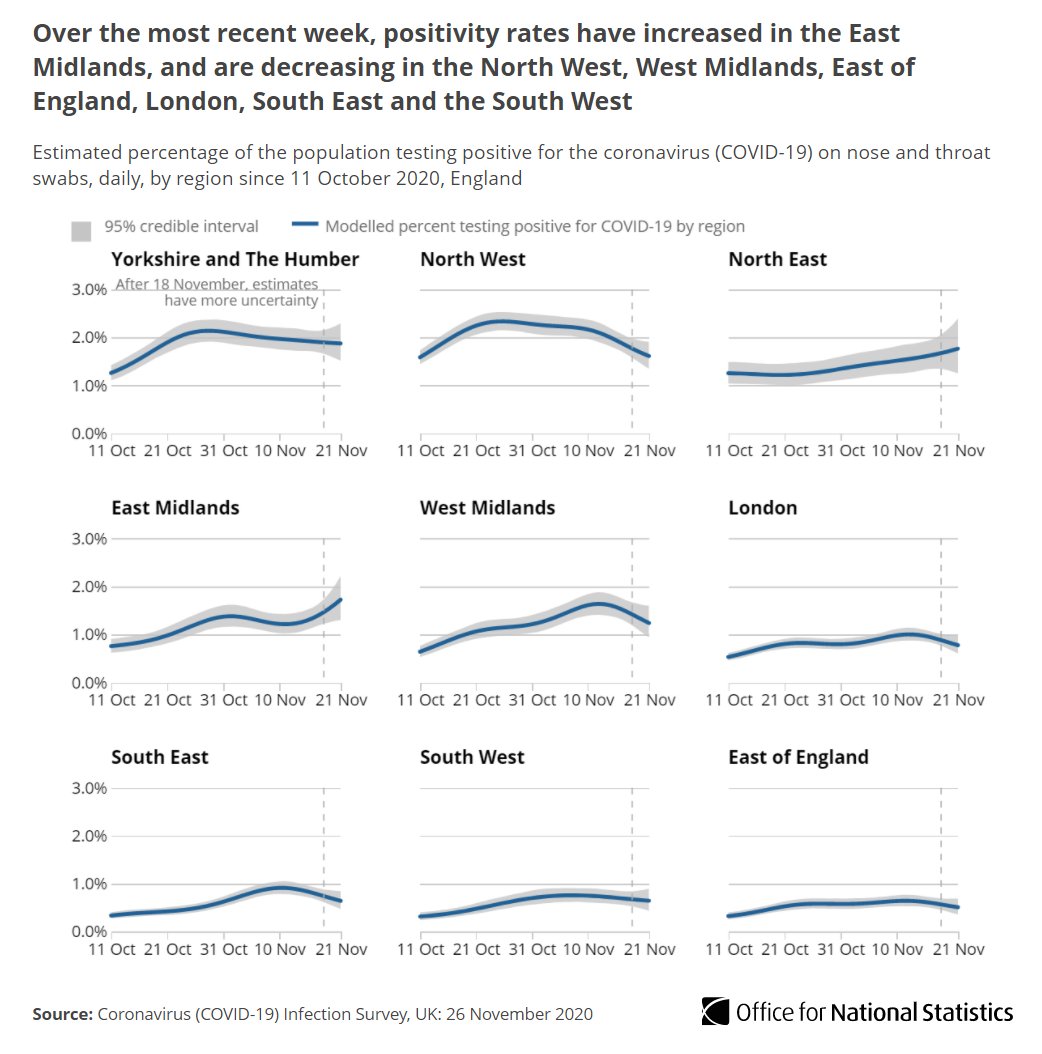
Infection rates have risen in the East Midlands.

Rates in Yorkshire and The Humber, the North West and the North East remain the highest, but seem to be falling in the North West, West Midlands, East of England, London, South East and South West ow.ly/m5yd50Cvu2W Chart title: Over the most ...
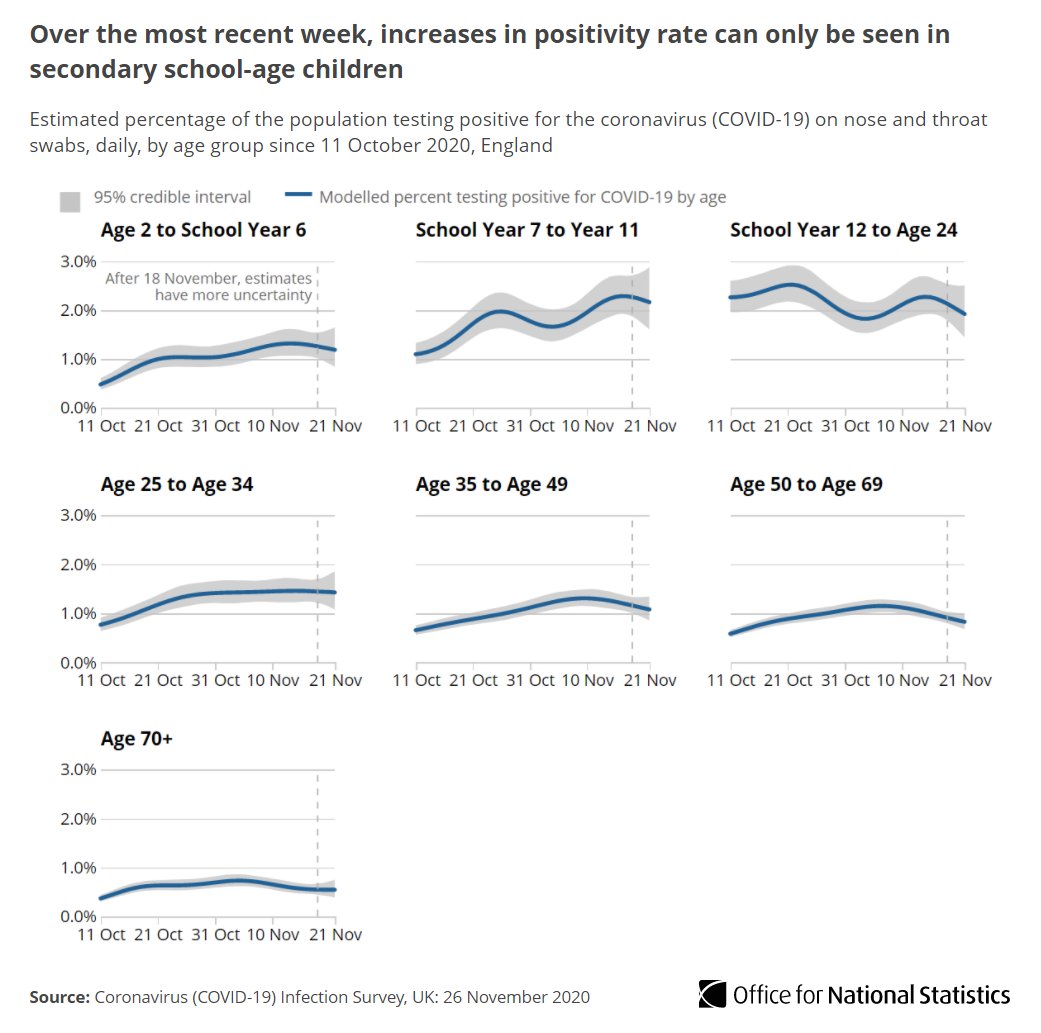
The highest infection rates in England remain among secondary school-age children and young adults.

Rates have decreased in adults aged 35 and above and levelled off for those

• age 2 to school year 6
• school year 12 to age 24
• age 25 to 34

ow.ly/m5yd50Cvu2W Chart title: Over the most ...
Read 6 tweets
26 Nov
Our latest economic and society impact indicators have been published today as part of our response to the #coronavirus pandemic ow.ly/uFEj50CvqYv Graphic showing virus icon ...
Of UK businesses that have not permanently ceased trading, 15% of their workforce were on furlough (in the period 2 to 15 November).

This is up from 9% in the previous fortnight ow.ly/khtI50Cvr4f
Meanwhile,

▪️ 30% of their workers were working remotely (up from 28%)
▪️ 51% were at their normal workplace (down from 60%)

➡️ ow.ly/AOWT50Cvr7W
Read 5 tweets
25 Nov
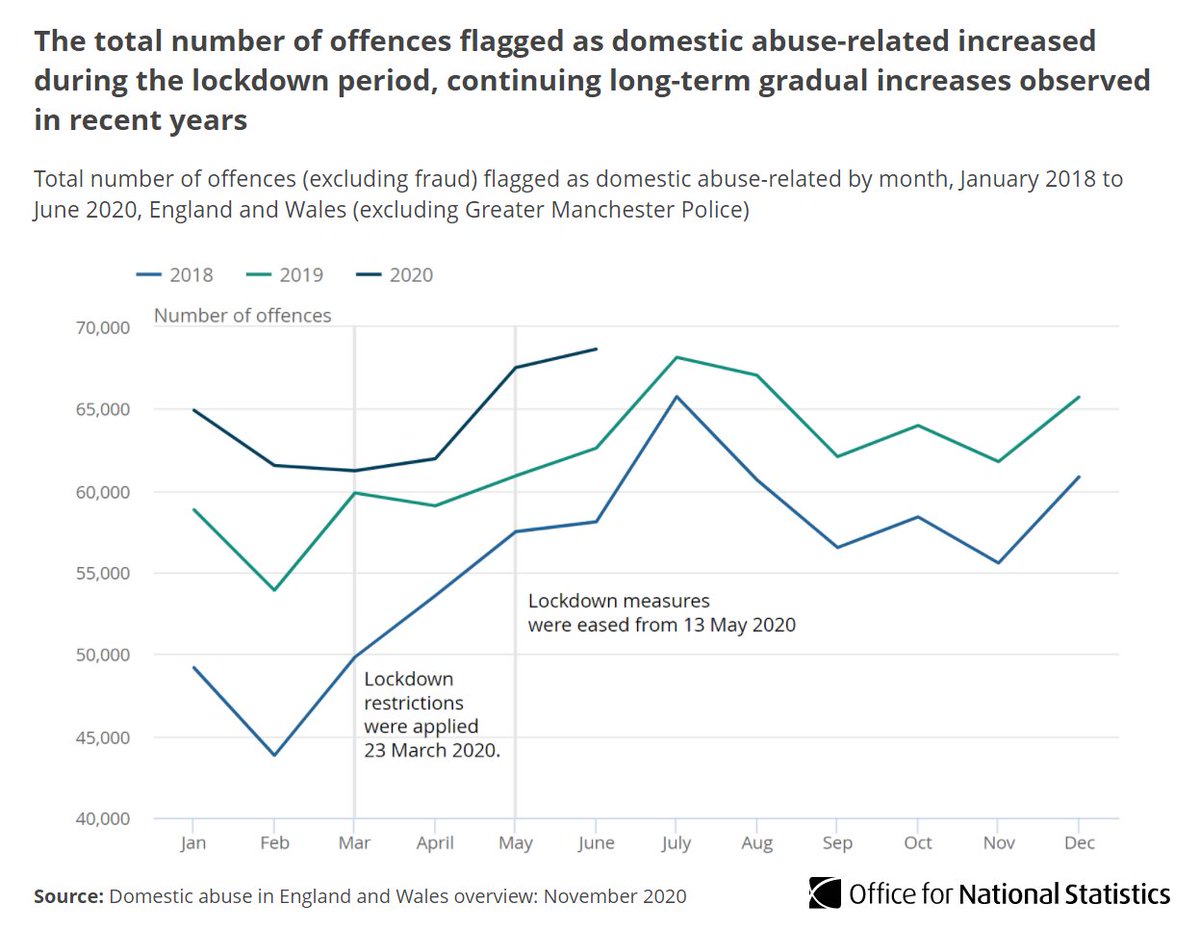
Analysis into the pandemic’s impact on domestic abuse shows a 7% rise in police recorded offences flagged as domestic abuse-related from March to June 2020 compared with the same period in 2019.

This continues long-term gradual increases in recent years ow.ly/BkuD50Cuil4 Chart title: The total numb...
There was a 65% increase in calls and contacts logged by the National Domestic Abuse Helpline run by @RefugeCharity between April and June 2020 compared with the first three months of the year ow.ly/6rgf50CuisP
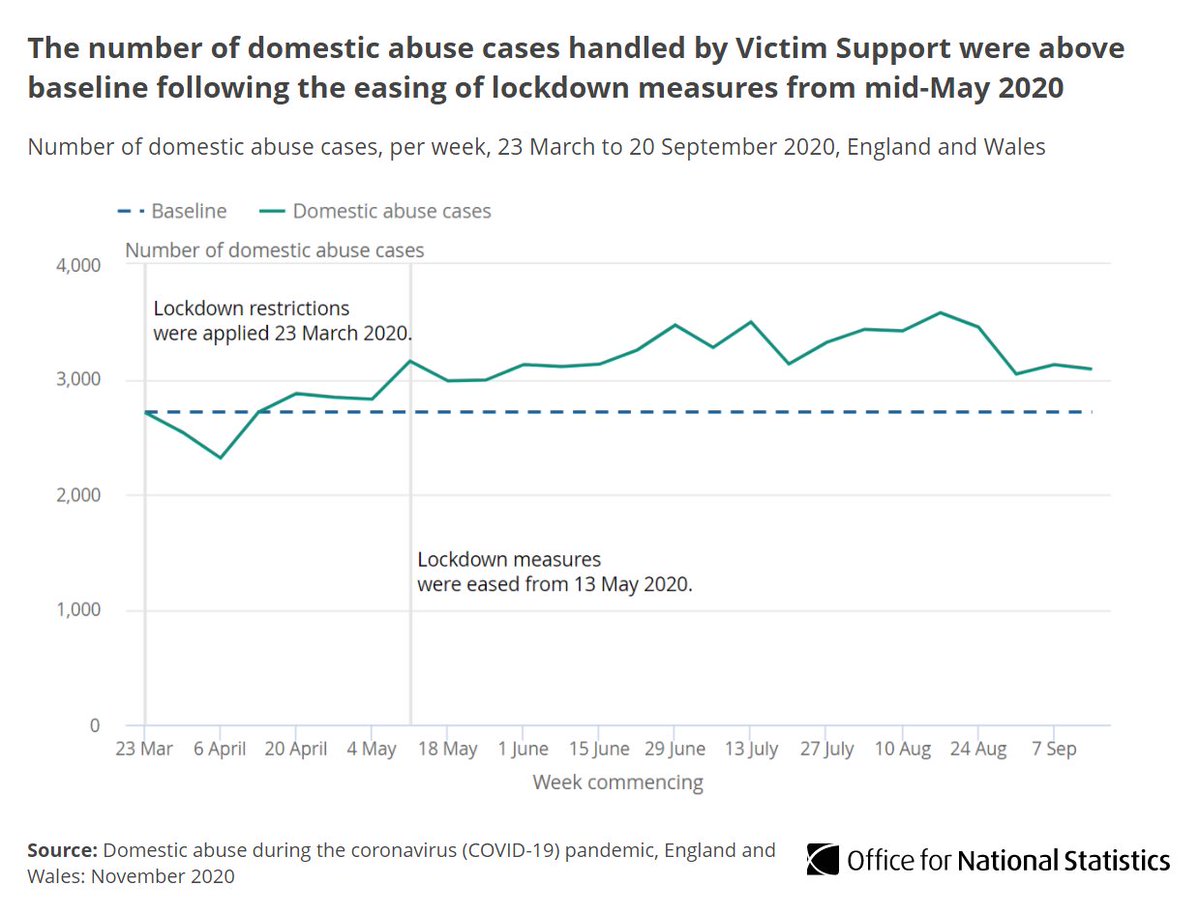
There was a 12% increase in the number of domestic abuse cases handled by @VictimSupport in the week lockdown restrictions were eased compared with the previous week ow.ly/fTD350CuiwT Chart title: The number of ...
Read 10 tweets
24 Nov
Our data show #COVID19 infections continued to increase during October.

We’ve provided more analysis on the characteristics of those testing positive across the UK, including antibody data ow.ly/FC9O50Ct8Om Graphic showing paper repor...
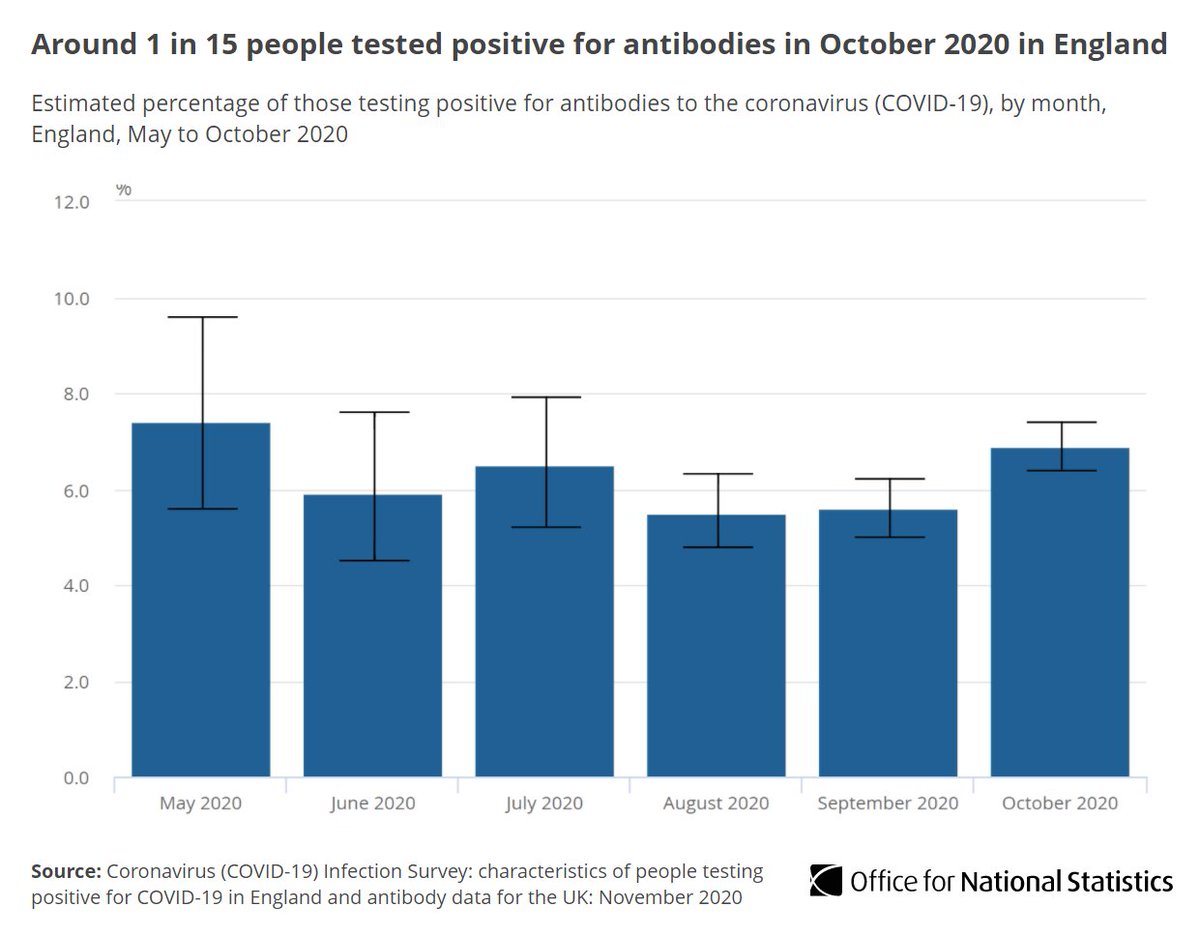
In England, around 1 in 15 people tested positive for #COVID19 antibodies in October, suggesting they previously had the virus.

We estimate 3.1 million people aged 16 or over in England would have tested positive for #COVID19 antibodies that month ow.ly/5xfb50Ct8PT Chart title: Around 1 in 15...
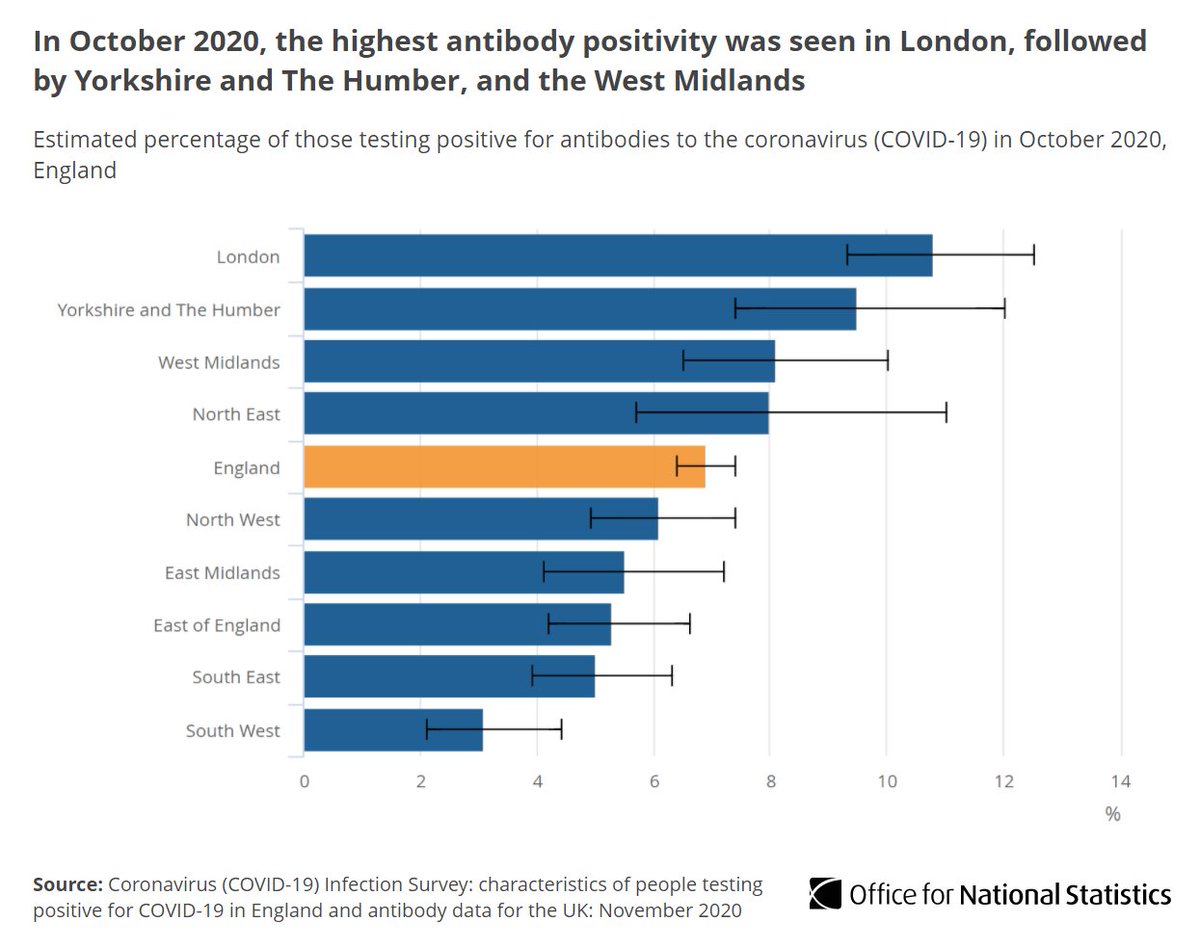
The highest rates of people testing positive for #COVID19 antibodies were seen in London, followed by Yorkshire and The Humber and the West Midlands in October ow.ly/OyTP50Ct8SQ Chart title: In October 202...
Read 7 tweets
13 Nov
Headline estimates for England suggest the continued rising infections have slowed.

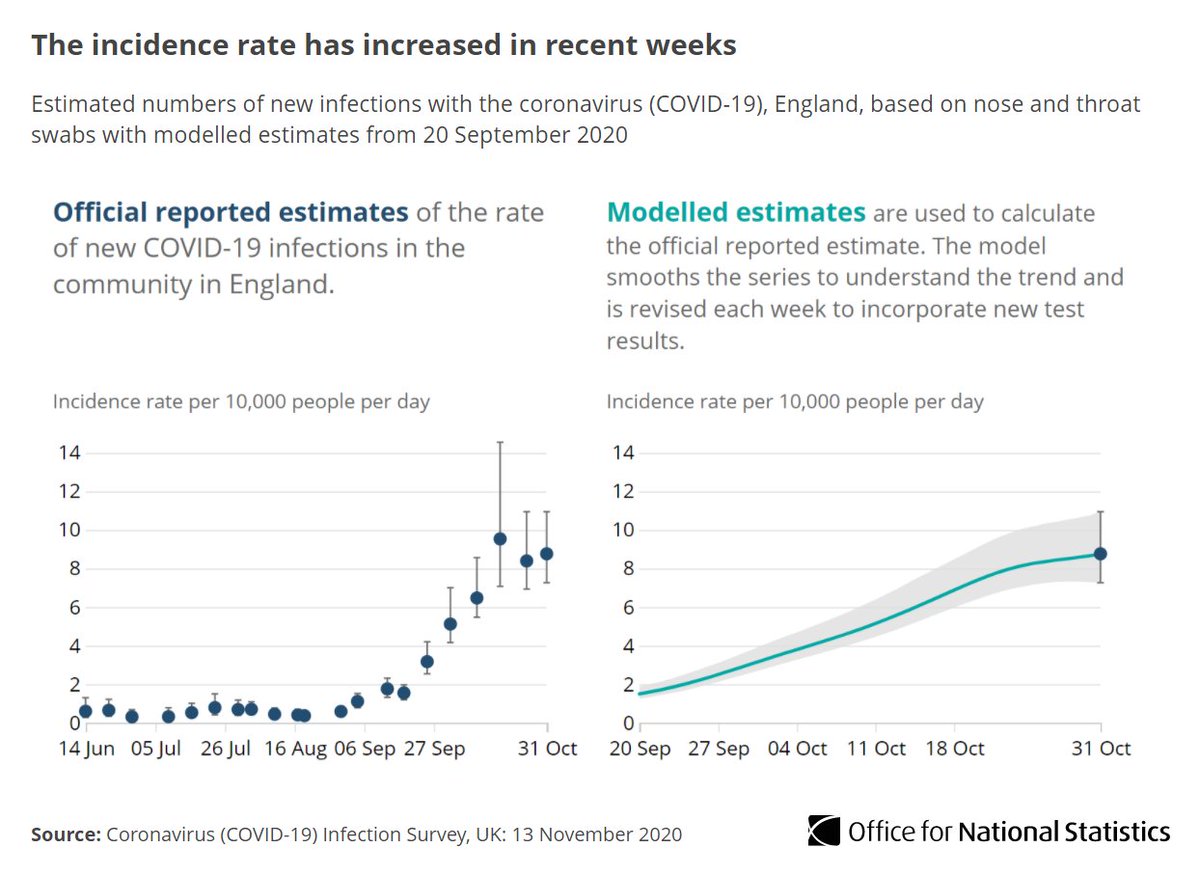
Around 1 in 85 people (not in care homes, hospitals or other institutional settings) in England would test positive for #COVID19 at any given time between 31 Oct and 6 Nov ow.ly/TheN50CjCCB The number of infections in England has increased in recent
During the most recent week (31 Oct to 6 Nov), we estimate there were around 47,700 new #COVID19 infections per day in England ow.ly/ufFx50CjCGi The incidence rate has increased in recent weeks.
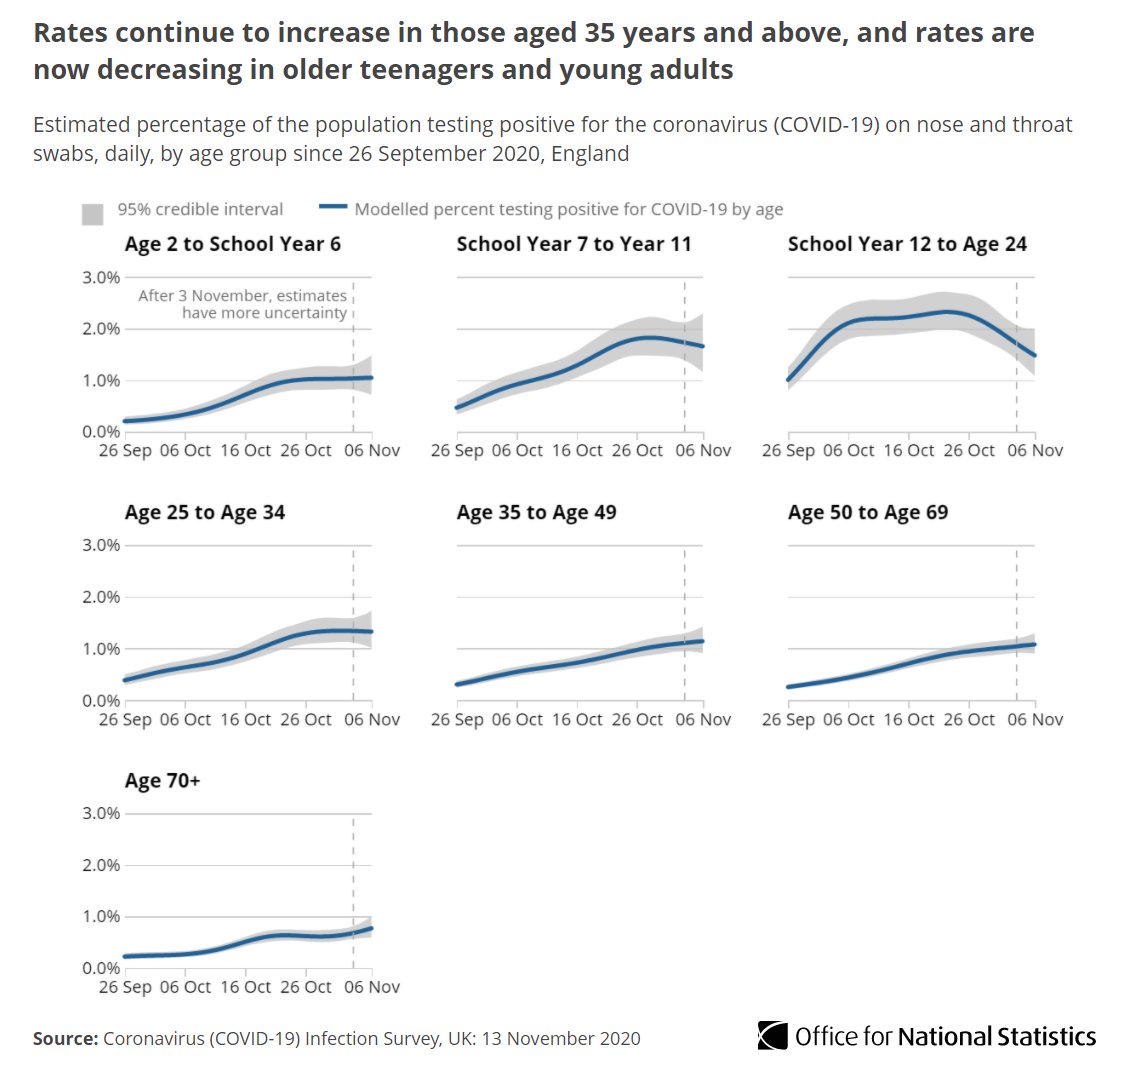
Infection rates have varied by age group:

▪️ increased infection rates for people aged 35 and over

▪️ decreasing infection rates for older teenagers and young adults

▪️ infection rates levelled off for younger children, teenagers and 25 to 34 year-olds

ow.ly/Oo3850CjCLV Rates continue to increase in those aged 35 years and above,
Read 8 tweets
13 Nov
This week, our Opinions and Lifestyle Survey looked more closely at the effects of the #coronavirus pandemic on different age groups.

These responses were collected from 5 to 8 November, when England started its national lockdown ow.ly/iGCj50Cjv3E Coronavirus and the social impacts on Great Britain: 13 Nove
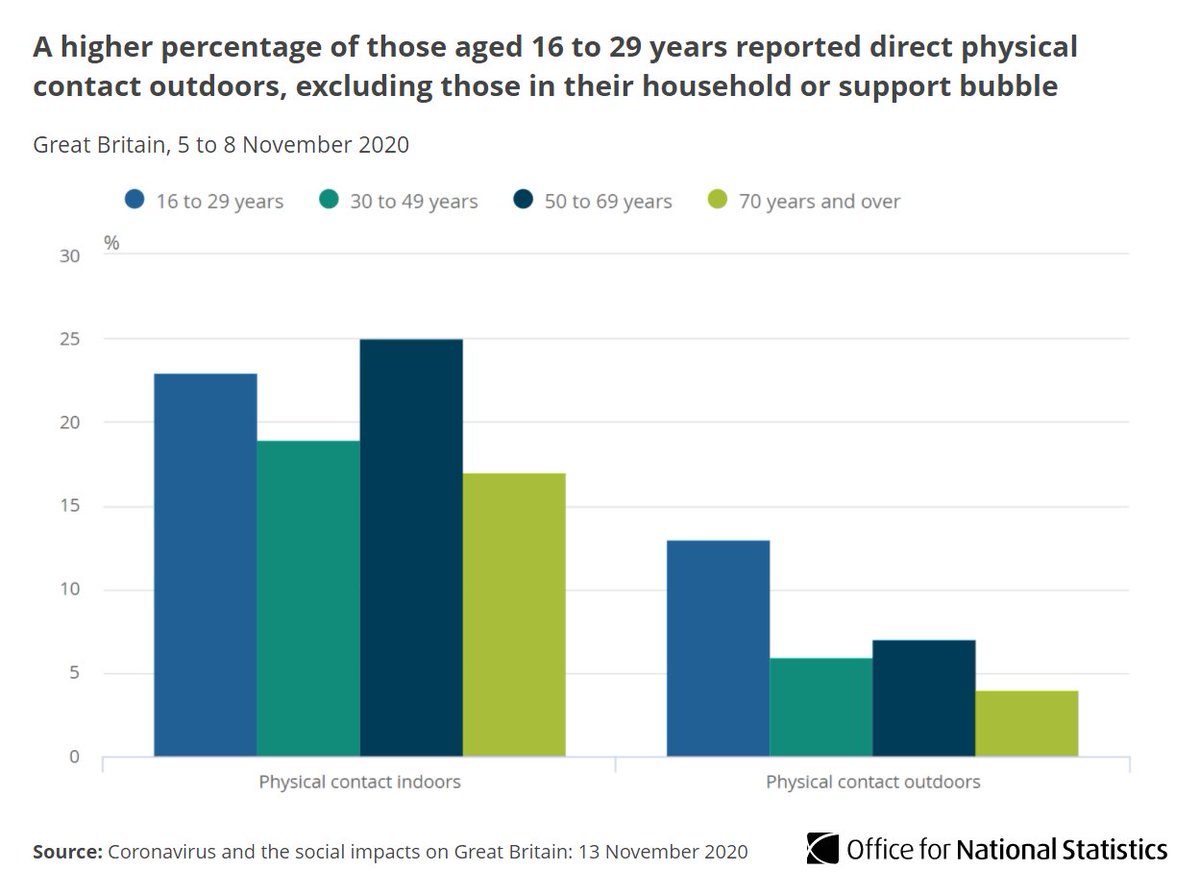
23% of adults aged 16 to 29 said they’d had physical contact with at least one other person when socialising indoors in the last 24 hours, excluding members of their household or support bubble.

This has fallen from 32% last week ow.ly/yqBF50Cjv7J A higher percentage of those aged 16 to 29 years reported di
When meeting people outside their support bubble or household indoors or outdoors, a smaller proportion of younger people maintained social distancing always or often:

▪️ ages 16 to 29 – 70%
▪️ ages 50 to 69 – 91%

➡️ ow.ly/7voV50Cjvd5
Read 6 tweets

Did Thread Reader help you today?

Support us! We are indie developers!


This site is made by just two indie developers on a laptop doing marketing, support and development! Read more about the story.

Become a Premium Member ($3/month or $30/year) and get exclusive features!

Become Premium

Too expensive? Make a small donation by buying us coffee ($5) or help with server cost ($10)

Donate via Paypal Become our Patreon

Thank you for your support!

Follow Us on Twitter!