This happens if you build more infrastructure than you can maintain and don't do the math to see how you'll replace it at the end of its life cycle.
Let's do some back of envelope math:
As of 1 Jan 2017, Calgary had $84.7B in infrastructure.
#yycplan
1/18
calgary.ca/content/dam/ww…
Let's do some back of envelope math:
As of 1 Jan 2017, Calgary had $84.7B in infrastructure.
#yycplan
1/18
calgary.ca/content/dam/ww…
https://twitter.com/chrisdoyle78/status/1334935196932530176
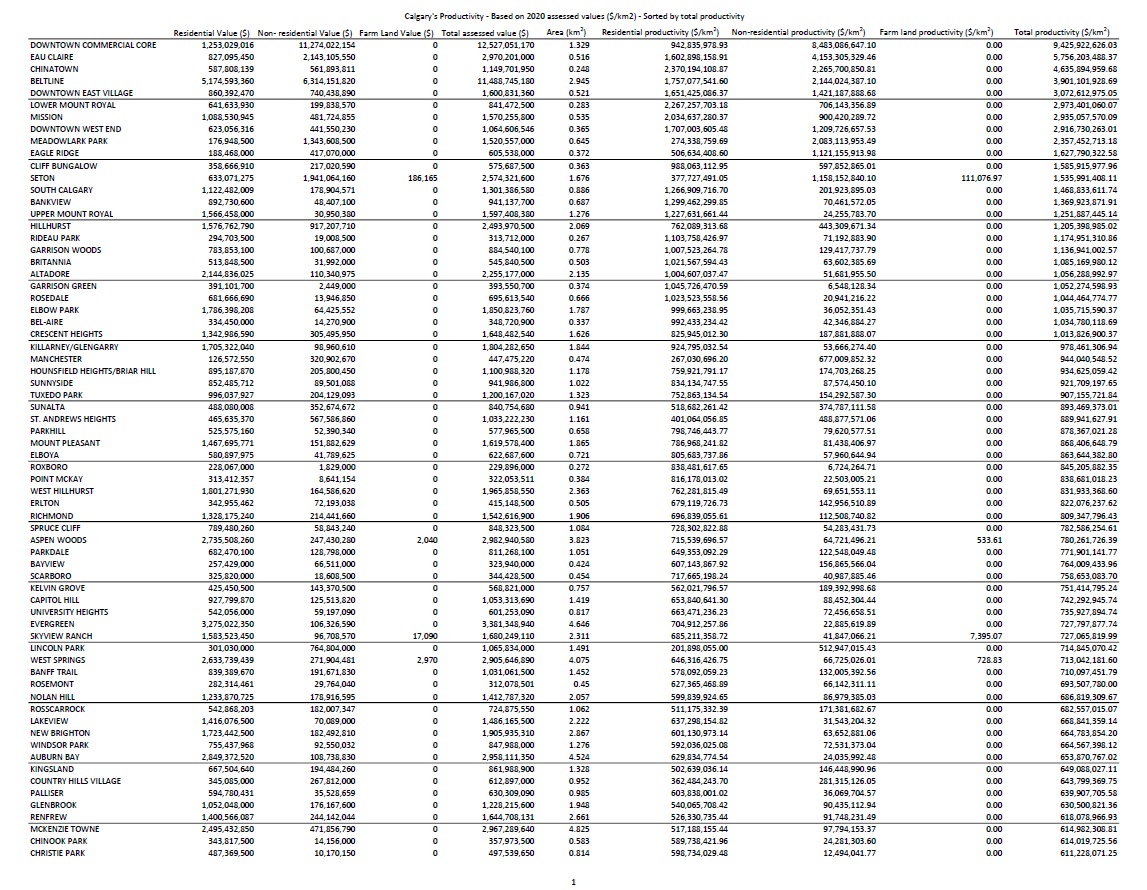
On 1 July 2016, Calgary's total assessed property value was $303B ($210B for res, $93B for non-res).
On 1 July 2017, Calgary's total assessed property value was $311B.
2/18
newsroom.calgary.ca/2017-property-…
newsroom.calgary.ca/news-release-2…
On 1 July 2017, Calgary's total assessed property value was $311B.
2/18
newsroom.calgary.ca/2017-property-…
newsroom.calgary.ca/news-release-2…
What's the ratio between our assessed value (private investment) and our infrastructure (public investment)?
Whether you use the values from six months before the infrastructure's assessed date ($303B), six months after ($311B), or an average ($307B), it's around 3.6:1.
3/18
Whether you use the values from six months before the infrastructure's assessed date ($303B), six months after ($311B), or an average ($307B), it's around 3.6:1.
3/18
That 3.6:1 ratio is far from "a target ratio of private investment to public investment of somewhere between 20:1 on the risky end and 40:1 on the secure end."
4/18
strongtowns.org/journal/2015/3…
4/18
strongtowns.org/journal/2015/3…
In other words, if your house or business is valued at $360,000, your portion of that infrastructure is $100,000. Or, for every $100,000 your house or business is worth, your share of Calgary's infrastructure is $27,777. Or, it's 27.7% of the value of your house or business.
5/18
5/18
The $84.7B from the infrastructure report is assessed value, which may not be the same as total current replacement value at the end of its life cycle. Like I said, it's back of envelope math.
But how long is our infrastructure's life cycle? Let's go back to the report:
6/18
But how long is our infrastructure's life cycle? Let's go back to the report:
6/18
In 2017, engineered structures (roads, bridges, track and stations, water treatment and distribution, wastewater collection and treatment, communications towers and cabling conduits, and landfills) made up $74.68B (88.16%) of our infrastructure.
7/18
7/18
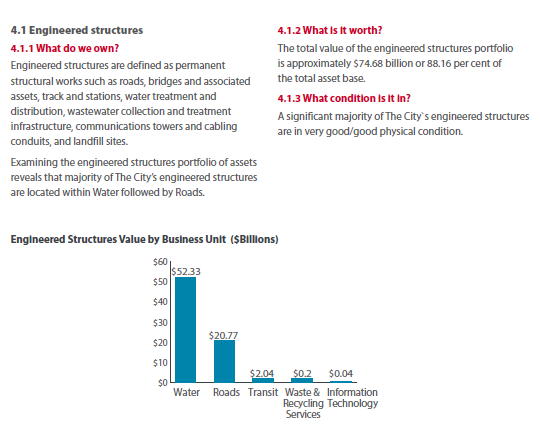
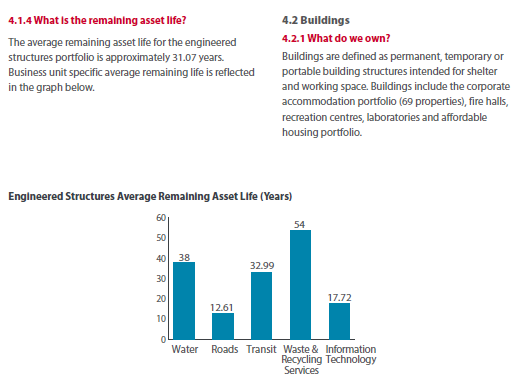
The 2017 infrastructure status report says, "The average remaining asset life for the engineered structures portfolio is approximately 31.07 years."
It shows that Water's $52.33B should last an average of 38 years, while Roads' $20.77B should last an average of 12.61 years.
8/18
It shows that Water's $52.33B should last an average of 38 years, while Roads' $20.77B should last an average of 12.61 years.
8/18
BTW, if we saved money to pay for those predicted maintenance costs (like saving to replace your roof), we'd save $1.38B/yr to Water and $1.65B/yr to Roads. If every Calgarian was aware of those numbers and thought about them, what would they want Council to prioritize?
9/18
9/18
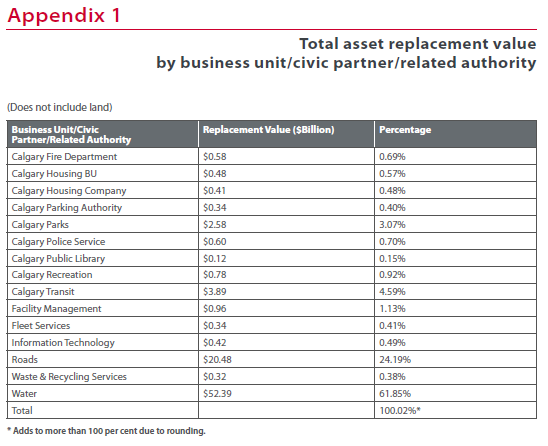
If you want to do more precise math by including the value of all infrastructure by business unit, civic partner, or related authority, it's in the appendix. However, you'll have to find all the infrastructure's remaining asset life to calculate the life cycle.
10/18
10/18
Back to the math, if the City needs $27,777 for every $100,000 of private investment to maintain current infrastructure and spreads that out over 31.07 years, it's $894/year for every $100,000 of assessed value. The people in that $360,000 house would pay $3218.54/year.
11/18
11/18
In other words, ignoring inflation, the City needs to raise $84.7B every 31.07 years for replacement costs. That's $2.7B/year.
If ~1.3M people live here during that time, it's around $2000/year/person for all infrastructure.
12/18
If ~1.3M people live here during that time, it's around $2000/year/person for all infrastructure.
12/18
If you're uncomfortable using engineered structures' life cycle for all infrastructure, maintaining $74.68B of engineered structures every 31.07 years is $2.4B/year, and $1800/year/person (w/o inflation).
In this case, we'd still need to replace the other $10B at its time.
13/18
In this case, we'd still need to replace the other $10B at its time.
13/18
That's only to maintain what we've built. It doesn't include operating costs for services like police, transit, parks, recreation, waste and recycling, etc. Depending on how the City did its math in the report, it may not include paying people to maintain infrastructure.
14/18
14/18
When we complain about rising taxes or other orders of government say the City should get its "fiscal house in order," we should remember we took decades to build this mess. Like any disaster clean up, it's going to take many people and tools to get out of it. If we can.
15/18
15/18
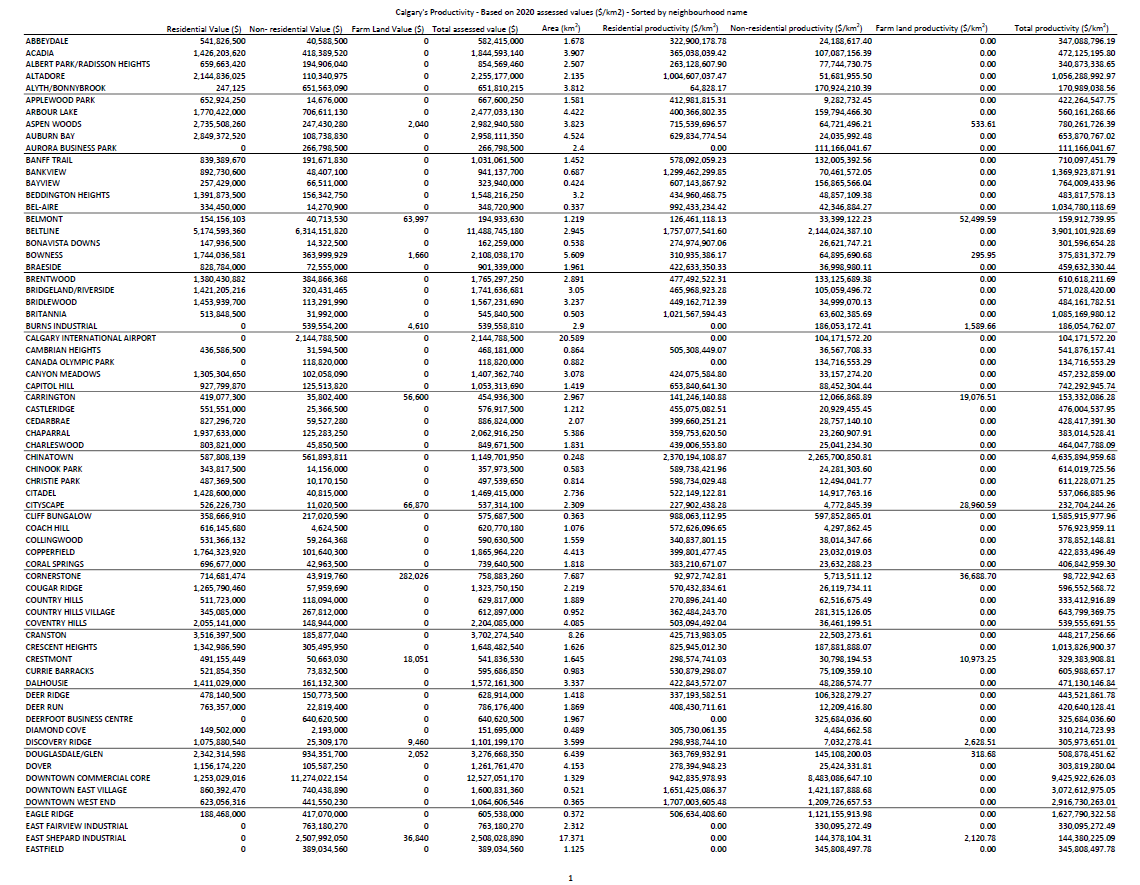
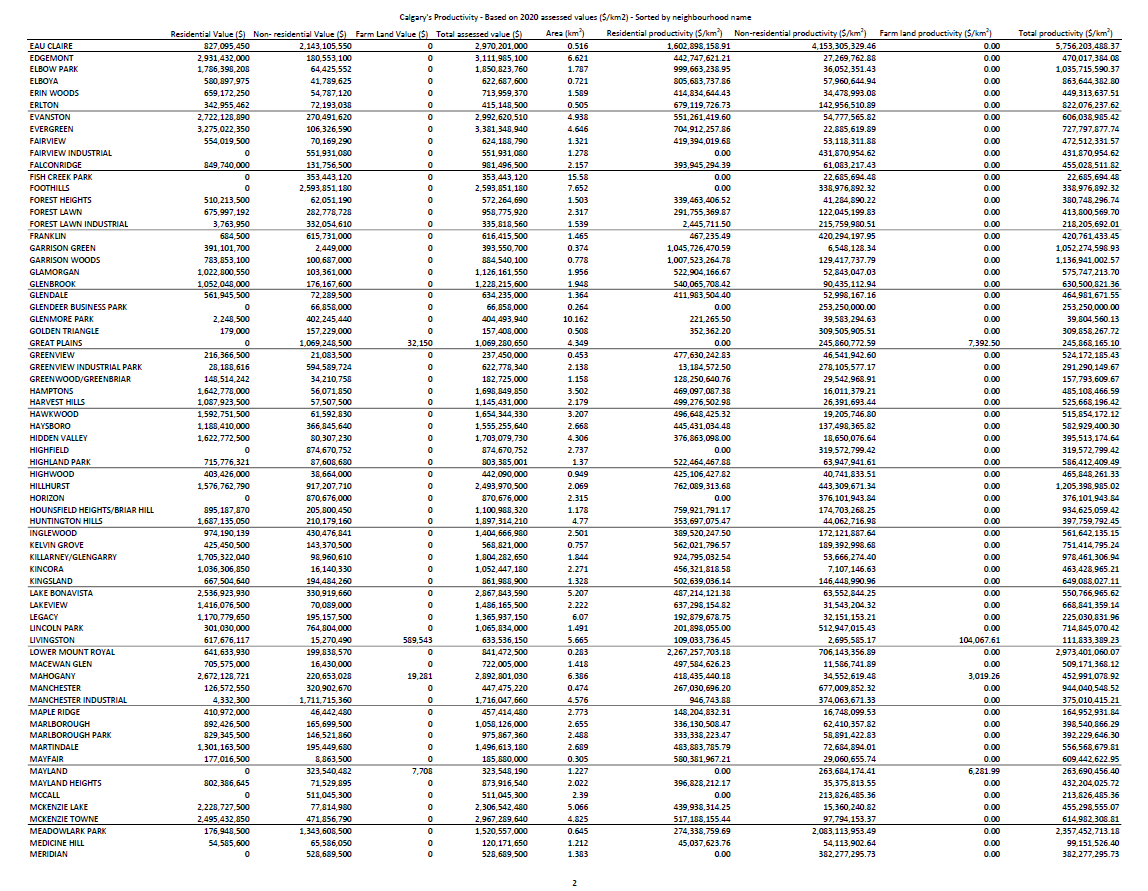
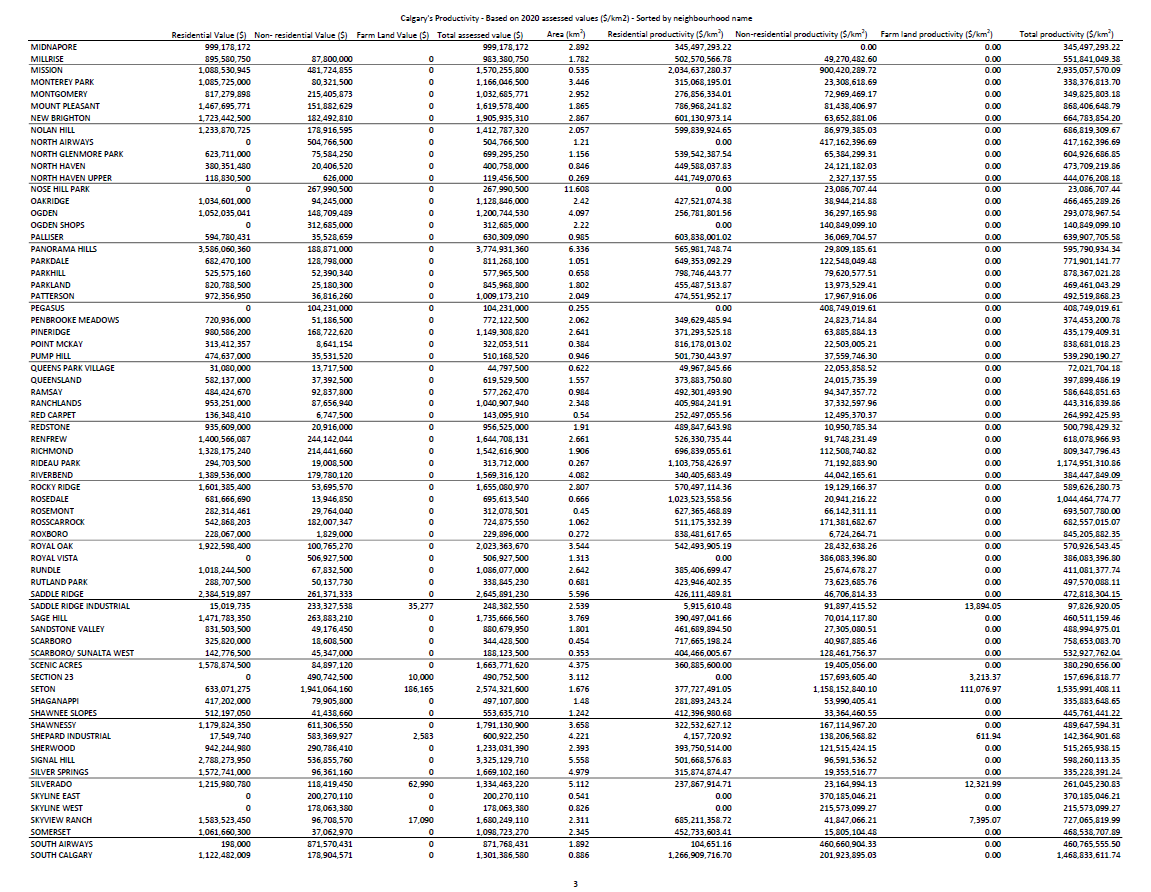
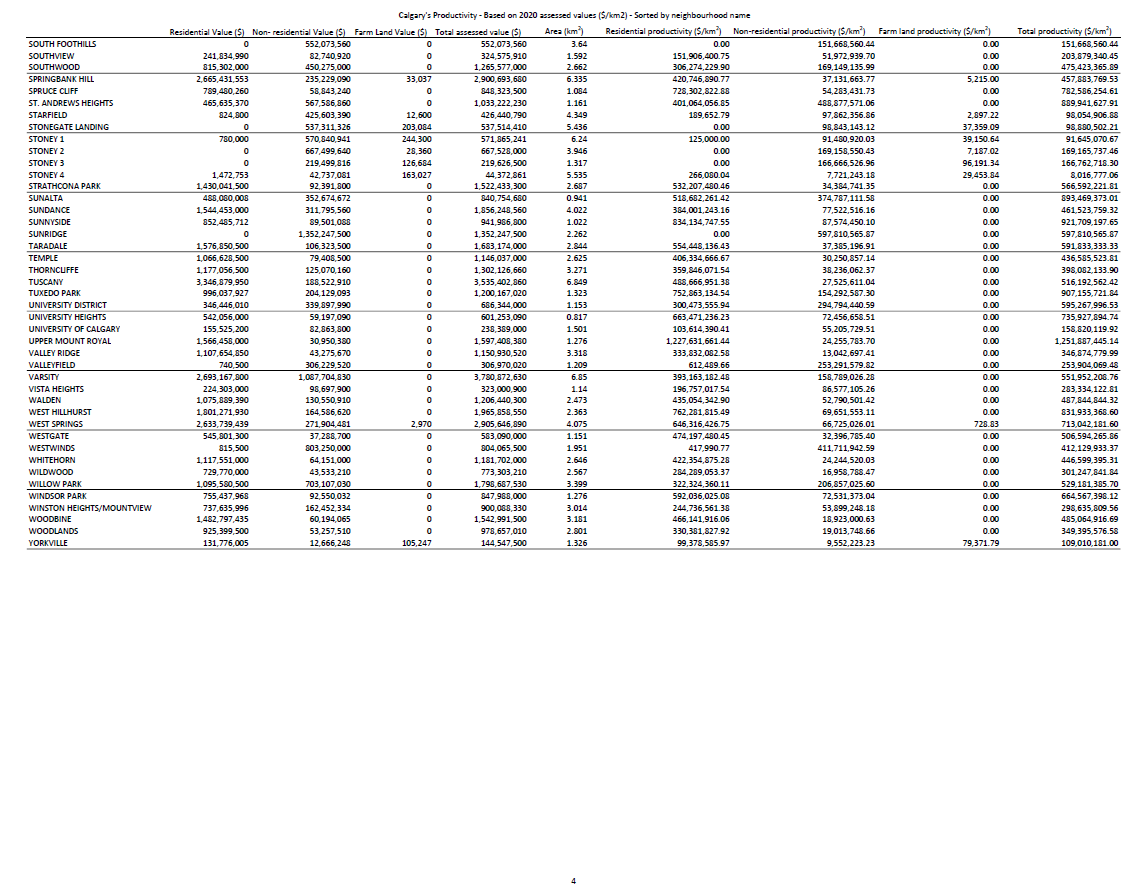
Some people say new areas don't pay for themselves. If we calculated each neighbourhoods' tax revenue and subtracted its costs, we'd likely find most existing neighbourhoods don't pay for themselves. We don't need to blame them, let's just allow them to be more productive.
16/18
16/18
When infrastructure stops serving people and people start serving infrastructure, you've built a city you can't afford.
As @clmarohn wrote, "It's not a problem. It's a predicament; it has no solution, only outcomes."
17/18
strongtowns.org/journal/2017/1…
As @clmarohn wrote, "It's not a problem. It's a predicament; it has no solution, only outcomes."
17/18
strongtowns.org/journal/2017/1…
Finally, this wonderful and surprisingly humourous blog from Winnipeg should get credit for showing how to do this math. It really is a fun blog about infrastructure and municipal finance!
And if you think I got the math wrong, help me correct it!
18/18
dearwinnipeg.com/2019/03/21/the…
And if you think I got the math wrong, help me correct it!
18/18
dearwinnipeg.com/2019/03/21/the…
Addendum:
If Calgary was in the 20:1 to 40:1 range that @clmarohn suggests, we'd have had $1.7-3.4T of private investment for our $84.7B of infrastructure in 2017.
Here's our ratio over time:
2010: 4.2:1 ($231.5B:$55.14B).
2013: 4.2:1 ($254B:$60.48B).
2017: 3.6:1 ($307B:$84.7B).
If Calgary was in the 20:1 to 40:1 range that @clmarohn suggests, we'd have had $1.7-3.4T of private investment for our $84.7B of infrastructure in 2017.
Here's our ratio over time:
2010: 4.2:1 ($231.5B:$55.14B).
2013: 4.2:1 ($254B:$60.48B).
2017: 3.6:1 ($307B:$84.7B).
• • •
Missing some Tweet in this thread? You can try to
force a refresh