Jamin Ball Profile picture
10 Dec, 14 tweets, 3 min read
My biggest takeaway from Q3 cloud earnings? We REALLY saw cloud businesses ACCELEERATE. Since Covid began we heard anecdotal data of "digital transformations accelerating." But the data was never there. It is now. Data below shows the absolute change in rev growth % from Q3 to Q2
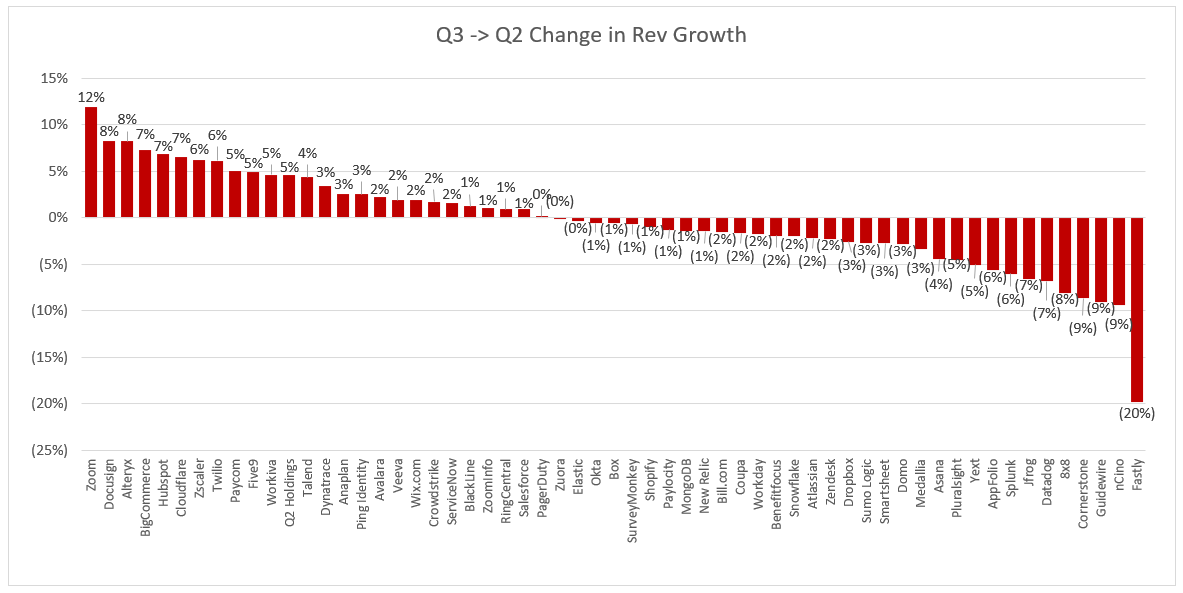
For further clarification - the graph shows the delta between Q3 YoY growth rate and Q2 YoY growth rate (I tried to normalize for acquisitions where I could, sure I missed some). As an example - Zoom grew 367% in Q3 and 355% in Q2, so the delta, 12%, is graphed.
I'm defining "accelerating" as YoY rev growth that is increasing on an absolute basis. And as you can see, there are plenty of businesses who accelerated this quarter
It is VERY interesting to compare this quarters data from last quarter. As you can see in my thread below, in Q2 we really only saw 2 businesses accelerate meaningfully, and 7 in total. This Q 26 companies accelerated

It's easy to see the distribution of both graphs from Q3 and Q2 to imply the difference. There is just such a heavier volume of companies that fall above the line in Q2
So what's happening? I think what I predicted after Q2 played out. Namely, procurement was pushed in Q2, and those deals closed in spades in Q3. Buyers knew they needed more cloud tech in Q2, but didn't start more normal buying patterns until Q3

My cloud Covid timeline this year

Q1: Little effect. The obvious Covid beneficiaries (Zoom, Shopify, etc) got slight boosts at tail end of quarter

Q2: Buyers buttoned up. All spend was cut. Only obvious winners benefited

Q3: budgets reopened, digital transformations played out
And here's the other interesting aspect of this graph. I'd argue a number of the high growth names who didn't technically accelerate, but maintained their high growth are also winners. Without Covid I bet their growth would have fallen off more
Here's who I include in that list. All have negative changes in my initial graph, but all very impressive quarters (this Q YoY growth / last Q YoY growth)

Snowflake: 119% / 121%
Shopify: 96% / 97%
Elastic: 43% / 44%
Okta: 42% / 43%
Mongo: 38% / 39%
Asana: 55% / 59%
Since the graph just shows the absolute change it's harder to make relative comparisons. Certain companies performances are masked when I present the data like I have. Crowdstrike only shows a 2% change. They grew 86% this Q, and 84% last Q. That is PHENOMINAL
The biggest winners of this quarter, in my opinion, were the companies that grew >50% YoY AND also accelerated. This list includes:

Zoom
Docusign
Cloudflare
Zscaler
Twilio
Crowdstrike

Including the "impressive maintainers" I'd add:
Shopify
Snowflake
I think everyone knows I love Datadog, but I just couldn't include them. They grew 61% YoY this Q, and 68% YoY last Q. Still very impressive. I'd have wanted to see >65% YoY growth this Q to put them in that "impressive maintainer" bucket. Next Q important for them. Want >60%
For Q4 I'll be keeping an eye on who can maintain their high growth. Any company that stacks multiple quarters of YoY acceleration, while growing >50% is 🤯🤯

I thought about making the bar >40% YoY growth while accelerating, but >50% is truly elite
One final note - this is NOT meant to be a commentary on valuations or stock prices. This is simply an analysis that I hope sheds light on which businesses are operating the best.

Valuation is an entirely separate discussion :)

• • •

Missing some Tweet in this thread? You can try to force a refresh
 

Keep Current with Jamin Ball

Jamin Ball Profile picture

Stay in touch and get notified when new unrolls are available from this author!

Read all threads

This Thread may be Removed Anytime!

PDF

Twitter may remove this content at anytime! Save it as PDF for later use!

Try unrolling a thread yourself!

how to unroll video
  1. Follow @ThreadReaderApp to mention us!

  2. From a Twitter thread mention us with a keyword "unroll"
@threadreaderapp unroll

Practice here first or read more on our help page!

More from @jaminball

1 Oct
Great report from Morgan Stanley today on the Identity Access Management market.

They claim an increasingly cloud-based and distributed workforce shifts security control towards Identity & Access Management, driving a considerably larger >$30B TAM vs. industry estimates 👇
IAM is the top CSO priority: Image
Their bottoms up TAM is MUCH LARGER than IDC. They believe the shift to cloud greatly expands the IAM market Image
Read 5 tweets
30 Sep
Some cool new Twilio products announced today at their Signal conference. As engagement channels shift from physical to digital Twilio has gotten a boost. 500% growth in Twilio Video usage, and total messages 2x first half of this year. More announcements below $TWLO
1) Twilio Frontline: a mobile application that allows field workers to seamlessly and securely engage directly with customers from their personal devices

2) Twilio Video Web RTC Go: a free toolkit that eliminates the complexity of building on top of WebRTC for video messaging
3) Twilio Flex Ecosystem: since its launch on the SIGNAL stage in 2018 Twilio Flex has added more than 100 new features. The Flex Ecosystem gives organizations access to more than 30 validated partner solutions from partners such as Google, Salesforce, Zendesk, and Calabrio
Read 4 tweets
24 Sep
A few weeks ago I shared a graphic looking at the change in YoY growth rates for SaaS businesses from Q2 to Q1. I thought another interesting analysis would be looking at the change in net new ARR added from Q2 to Q1. The data below shows the % change: Image
To calculate net new ARR in a given quarter I first take the quarterly subscription revenue (where disclosed) and multiply it by 4 to get an implied ARR metric. I do the same thing for the quarter prior. The difference between the 2 is the implied net new ARR added in a quarter
What's graphed is the % change in net new ARR added in Q2 vs Q1.

An example: Fastly added $48.3M net new ARR in Q2 and $15.8M of net new ARR in Q1. The number shown is the growth in net new ARR 205%. (shoutout to my Fastly bulls)
Read 15 tweets
23 Sep
Zuora's annual subscription economy report it out! Some takeaways:

1. Subscription companies continue to outperform their product-based peers by wide margins, growing revenues approximately 6X faster than S&P 500 companies (17.8% versus 3.1%)
2. Subscriber growth took a big dip in Q1 as the pandemic started, but rebounded in a big way in Q2
3. Revenue per user slows slightly. Overall for the SEI, growth in average revenue per account has slowed compared to the end of 2019, in some cases representing users who refrained from upgrading services in an economic downturn + more discounts
Read 7 tweets
19 Sep
Looking at the share price reaction for SaaS businesses the day after reporting Q2 earnings makes it appear like most stocks fell (the median stock fell 2.5%). However if you look at how the share price after earnings compared to 2 weeks prior it paints a different picture! Data: Image
This is particularly true for businesses with July Q ends who saw big run ups in share price in the couple days leading up to earnings, then big drops right after. Fastly (June Q end) was the epitome of this. Down 19% the day after earnings, but up 17% compared to 2 weeks prior!
Here's the data for the day after share price reaction for comparison: Image
Read 4 tweets
17 Sep
Unity IPO will be a very interesting one to track - they're breaking from the traditional pricing mechanism. Typically investment banks take companies on a roadshow, collect and manage orders / allocations from large institutional funds, and then ultimately help set price
The Unity team is maintaining full control of pricing / allocations. They will collect bids from funds that have a price and a preferred # of shares. Based on all of these bids, the Unity team will then come up with a price.
Any fund with a bid below the price won't receive an allocation (no shares). For funds with bids at or above the selected price, the Unity team will decide how many shares to allocate (can be full or partial fill of the desired total).
Read 8 tweets

Did Thread Reader help you today?

Support us! We are indie developers!


This site is made by just two indie developers on a laptop doing marketing, support and development! Read more about the story.

Become a Premium Member ($3/month or $30/year) and get exclusive features!

Become Premium

Too expensive? Make a small donation by buying us coffee ($5) or help with server cost ($10)

Donate via Paypal Become our Patreon

Thank you for your support!

Follow Us on Twitter!