Prof Profile picture
17 Dec, 10 tweets, 3 min read
I believe that if we had spent 1% of the money we are burning on testing to supply everyone over 60 with enough N95s, and let the life to go on as normal, we would have max. 10% of the current mortality.

But we keep insisting on the wrong mode of transmission. (1/x)
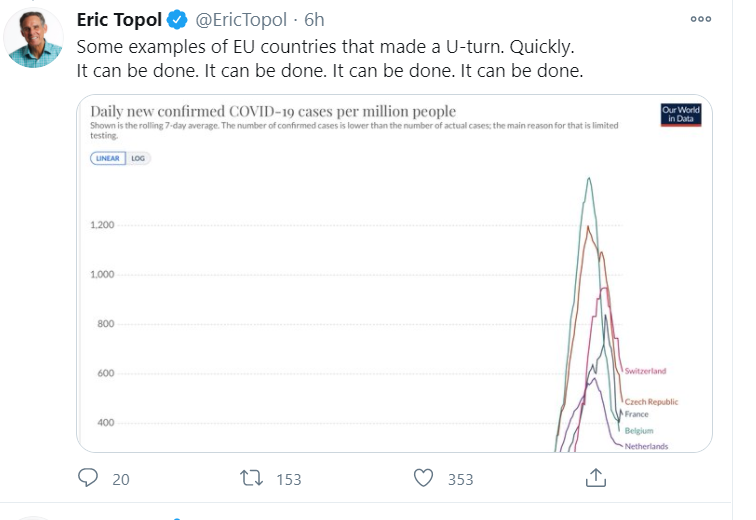
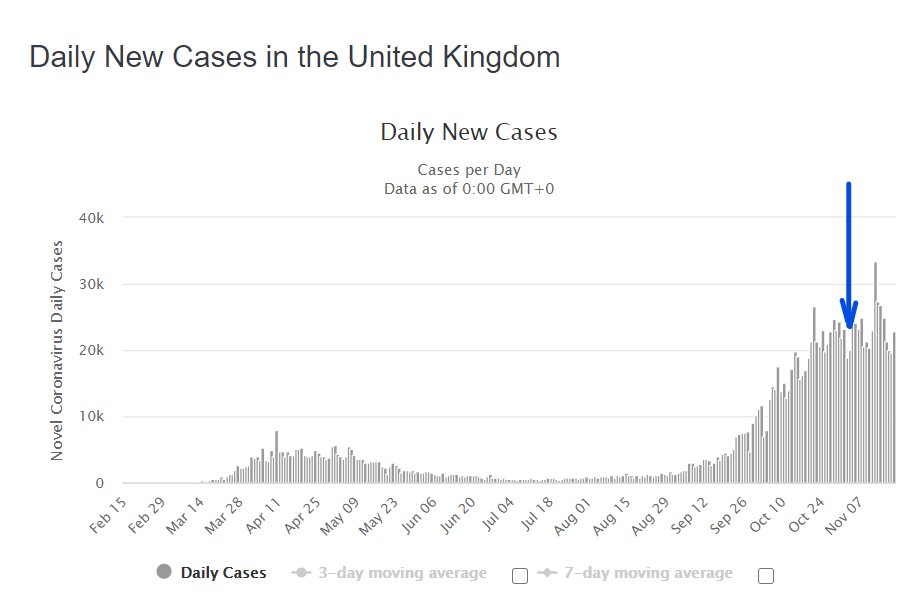
We operate under a droplet model and do the things that should work, like masks, distance, contact tracing. None of those things work - as seen repeatedly since October.

Without any apparent change in human behavior, cases are skyrocketing. (2/x)
I wouldn't be surprised if we one day discover that this virus, like pollens, don't need droplets of any size (not even aerosols) to float in the air, at right temperatures/humidity. Like mold, it stays in the air, and infects when they find the right host environment. (3/x)
Actually, maybe every virus does this, but because our bodies know them, one or two counts are not enough to infect us, and that's why we need larger doses (droplet) to get sick with them.

But when a new pathogen arrives, it is a different ballgame. (4/x)
Using a way analogy, our defenses are highly effective at killing say 50 invaders if their weapons are well-known.

But one invader with a different weapon can knock our defenses down and get into the body. (5/x)
Since I am not a virologist, I am just speculating here. But nothing other than this virus getting airborne under certain conditions explains these spikes we see in places like LA. When the weather is right, like pollens, it fills the air, infects thousands at once. (6/x)
Obviously, such a discovery would be a public health messaging nightmare, but also would allow us to focus on the right dangers and do the right things instead of wasting our energy.

We would focus on N95s, ventilation, even forecasting... (7/x)
For example, imagine we know exactly when the virus is airborne, and like pollen warnings with weather forecasts, we see virus warnings, so at-risk people either stay home or use N95 on those days.

But this would require accepting seasonality and properly researching it. (8/x)
Instead, our messaging denies seasonality and emphasizes close contact settings and droplets.

If the goal is giving people something to do so they don't go insane, it is working. If the goal is reducing spread, its effect is likely negligible. (9/x)
I hope this is not too into the "crazy" or "sci-fi" territory.

Again, I am not an expert on these things. But I do have a Ph.D., which means I am probably decent at making observations and digesting data.

Something does not fit... (10/10)

• • •

Missing some Tweet in this thread? You can try to force a refresh
 

Keep Current with Prof

Prof Profile picture

Stay in touch and get notified when new unrolls are available from this author!

Read all threads

This Thread may be Removed Anytime!

PDF

Twitter may remove this content at anytime! Save it as PDF for later use!

Try unrolling a thread yourself!

how to unroll video
  1. Follow @ThreadReaderApp to mention us!

  2. From a Twitter thread mention us with a keyword "unroll"
@threadreaderapp unroll

Practice here first or read more on our help page!

More from @covidtweets

6 Dec
COVID hospitalizations are breaking records, yet overall utilization seems relatively unchanged and mostly normal for this time of the year. How can this be?

How can hospitals both be overwhelmed but also have about the same number of beds available as a month ago? (1/x)
Let's say we randomly select a group of people from the population every day, and have them spend the night in a hospital. Of course they are not random, but that is not the point.

When there is more spread, more of the people who are selected each day will have it. (2/x)
Let's look at NC numbers. The situation is similar in many places.

COVID hospitalizations increased by about a thousand in the past month, but overall utilization is the same. How is this happening?

It is all about COVID unit capacity. (3/x)
Read 8 tweets
29 Nov
I am beginning to think that the widely accepted model of COVID mainly transmitting between close contacts via droplets is insufficient to explain the data and failing the Occam's razor. Instead, aerosols being the main route of transmission does better in both. (1/x)
Before I explain my reasoning, usual caveats: I am not a virologist/epidemiologist/medical professional/etc. I am just a scientist in another field who is observing the data and trying to make sense of it. So take the following with the usual grain of salt. (2/x)
First, what is Occam's razor? It means generally the theory which require the least number of assumptions is correct. A good example is geocentric vs. heliocentric models, the latter of which requires only one assumption - planets orbit the Sun. (3/x)
ImageImage
Read 13 tweets
23 Nov
Additional analysis on Kansas mask data: Does the size of the first wave (case levels before June) have an impact on the change in cases between August 11th - November 20th? (1/x)

Using population adjusted case numbers, below are the correlations between first wave cases, mask mandate, and change in cases after August. There is a significant negative correlation between first wave size and change after August. (2/x)
The correlation between masks and change is positive, meaning mandate counties had bigger changes. However, this is likely confounded by first wave size, as three counties with bigger first waves are non-mandate counties. (3/x)
Read 6 tweets
23 Nov
The new CDC study on mask effectiveness compares Kansas counties with and without mask mandates and finds that masks are effective.

Are they, really? (1/x)

cdc.gov/mmwr/volumes/6…
The first red flag comes from the data they used for analyses. They pick two seemingly random weeks from before and after the mandates and compare the changes in case numbers. They find that cases doubled in non-mandate counties and slightly declined in mandate counties. (2/x)
While this looks like cherry-picking, the results are actually similar when we compare mandate vs. non-mandate counties in terms of overall increase since August. On average, cases per 100K increased by x19 in non-mask counties vs. x9 in mask counties. (3/x)
Read 8 tweets
22 Nov
While it is too early for interventions to take effect in ND, I wanted to post an update regarding our quasi-experiment comparing SD/ND after ND implemented restrictions and mask mandates, effective Nov. 14th, and SD did not. (1/5)
First, cases: While ND is trending higher, both seem to have turned downward around the time ND implemented the mandates. No divergence so far. However, it is important to note that infections take around a week to be counted as a case, so any effect would not show yet. (2/5)
Second, hospitalizations: This also seems to have stabilized and turning downward in both states, although it is more pronounced in ND. (3/5)
Read 5 tweets
20 Nov
Many times, we go see a doctor or take a pill when we are feeling the worst, right before we would naturally be feeling better. Then we attribute the outcome to the intervention....

Like those who think lockdowns turned things around in Europe. (1/x)
Topol shows a few countries as examples to how "it can be done". He is missing one though, so I added that...

When these countries enacted restrictions, cases were already peaking. Lockdowns, again, did nothing. Below I show a few examples... (2/x)
UK enacted LD on Nov. 5. However, cases were flat since Oct. 24, and with a minimum 7-day delay between an infection and it being counted as a case, infections were stable since mid-Oct. Lockdowns were so effective that they worked two weeks before being implemented! (3/x)
Read 7 tweets

Did Thread Reader help you today?

Support us! We are indie developers!


This site is made by just two indie developers on a laptop doing marketing, support and development! Read more about the story.

Become a Premium Member ($3/month or $30/year) and get exclusive features!

Become Premium

Too expensive? Make a small donation by buying us coffee ($5) or help with server cost ($10)

Donate via Paypal Become our Patreon

Thank you for your support!

Follow Us on Twitter!