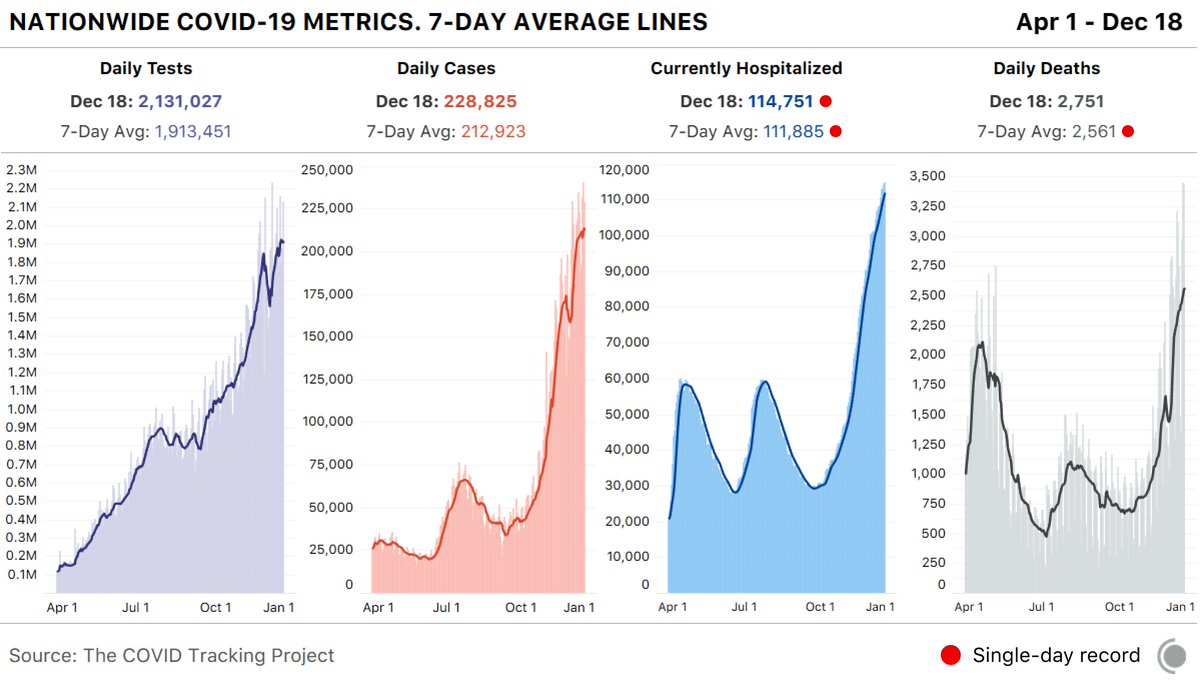
Our daily update is published. States reported 2.1 million tests, 229k cases, and 2,751 deaths. There are a record 114,751 people currently hospitalized with COVID-19. 4 bar charts showing key COVID-19 metrics for the US over ti
While the total number of deaths in the Midwest is still high, the 7-day average has started to decline in the region. 4 bar charts w/ 7-day avg lines showing COVID-19 deaths by U
NV and AZ currently have the highest hospitalizations per million people in the country. line chart showing currently hospitalized per million by sta
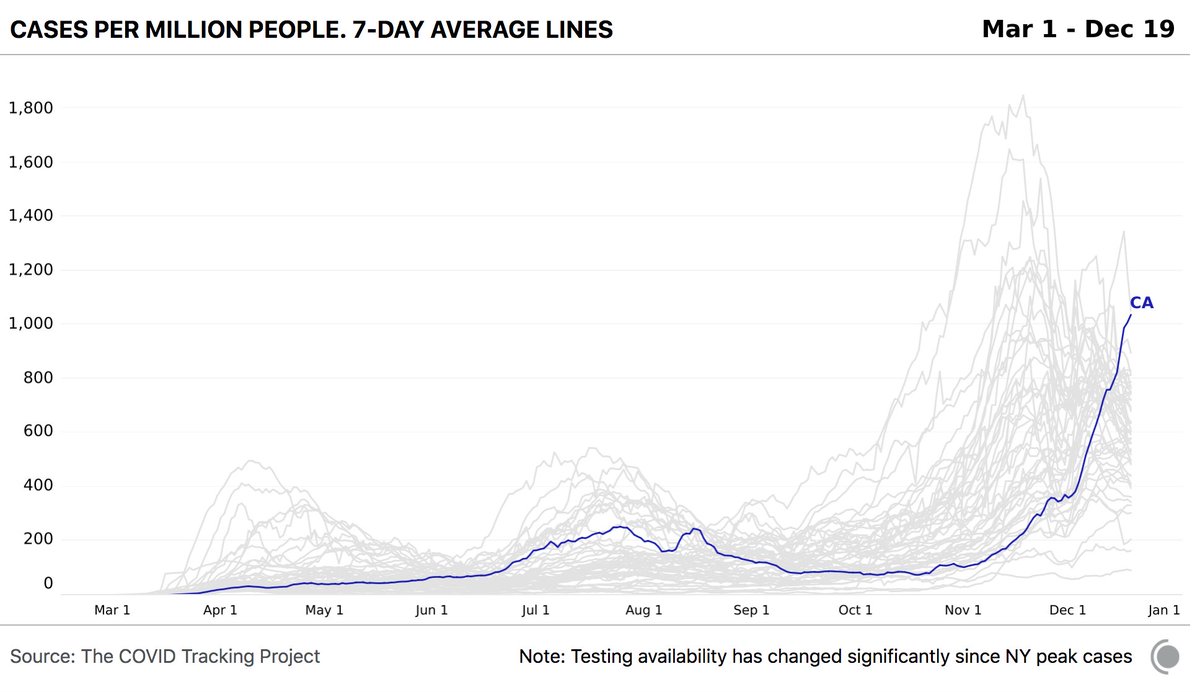
Per capita cases are growing at an alarming rate in AZ again. There are 1,049 new COVID-19 cases per million people in the state. In CA, the 7-day average for new cases per million people is quickly approaching 1,000. line chart showing 7-day average cases per million people by
WA revised their total test numbers down by 667k. The state's dashboard noted duplicate case counts and incomplete data from November 21 to December 16.

• • •

Missing some Tweet in this thread? You can try to force a refresh
 

Keep Current with The COVID Tracking Project

The COVID Tracking Project Profile picture

Stay in touch and get notified when new unrolls are available from this author!

Read all threads

This Thread may be Removed Anytime!

PDF

Twitter may remove this content at anytime! Save it as PDF for later use!

Try unrolling a thread yourself!

how to unroll video
  1. Follow @ThreadReaderApp to mention us!

  2. From a Twitter thread mention us with a keyword "unroll"
@threadreaderapp unroll

Practice here first or read more on our help page!

More from @COVID19Tracking

20 Dec
Our daily update is published. States reported 1.7 million tests, 202k cases, and 2,704 deaths. There are 114k people currently hospitalized with COVID-19 in the US. 4 bar charts showing key CO...
Today’s 7-day averages for current hospitalizations and deaths are record highs. The weekly view shows both metrics rose significantly from last week. 4 bar charts showing weekly...
California reported over 40k cases today. When we look at per-capita cases, the state is trending up with a 7-day average of more than 1,000 new cases per million people. Chart showing average cases...
Read 5 tweets
18 Dec
1/6 Ten months into the COVID-19 pandemic, and there are now several test types available in the United States. In this post, we explain how each one works and compare their pros and cons. By @juledurg and @jessicamalaty covidtracking.com/blog/test-type…
2/6 As COVID-19 cases surged in the spring and states reported shortages and turnaround delays with PCR testing, new COVID-19 test types started coming into play. Graphic showing when the FDA authorized each test type. PCR:
3/6 The various test types can be categorized in two ways: diagnostic tests (like PCR and antigen tests), which detect current infections, and serology tests (like antibody tests), which identify past infections. Illustration showing two categories of tests: diagnostics (w
Read 6 tweets
18 Dec
Our daily update is published. States reported 1.9 million tests, 242k cases, 3,438 deaths, and 114k people currently hospitalized with COVID-19 in the US. Both case and hospitalization counts from today are all-time highs. 4 bar charts showing key COVID-19 metrics for the US over ti
Hospitalizations per million people are now higher in the Northeast and West than in the Midwest. 4 bar charts side by side show currently hospitalized per mi
Today, we crossed 300,000 deaths since the start of the pandemic. And there are no signs of this curve slowing down: 17 days into December, this month is already the second deadliest of the pandemic. Bar chart shows US monthly COVID-19 deaths. April has the hi
Read 5 tweets
17 Dec
Our weekly update is published. The case data this week is mixed: hope in the Midwest is balanced by strong surges elsewhere, especially California. States reported a record high of new COVID-19 deaths for the second week in a row. covidtracking.com/blog/vaccine-a… 4 bar charts showing key COVID metrics for the US over time
States have reported that more than 50,000 Black people have died of COVID-19. As stark as this number is, it is most certainly an undercount due to incomplete racial and ethnic demographic demographic data available. covidtracking.com/race US Cartogram showing deaths among Black people per 100,000 f
As hospitalizations continue to rise nationwide, many states that experienced significant outbreaks in earlier months are again under strain. 12 states have surpassed 300 currently hospitalized per million people in 2 distinct periods. Louisiana has been above that level 3 times. Bubble chart showing COVID-19 hospitalizations by week per m
Read 4 tweets
17 Dec
Our daily update is published. States reported 1.8 million tests, 231k cases, and a record 3,400 deaths. There are 113,069 people currently hospitalized with COVID-19, a new record for hospitalizations. 4 bar charts showing key COVID-19 metrics for the US over ti
The new 7-day average for deaths in the South is at an all-time high. The region reported 1,053 deaths today, a new single-day record. 4 bar charts showing deaths from COVID-19 for each US region
CA reported a staggering 53,711 cases today. The highest single-day case count and 50% higher than any single-day case count from any state. Cartogram showing the new COVID-19 cases by state for Dec 16
Read 4 tweets
16 Dec
Long-term care cases and deaths both increased by the most we’ve seen since late May. A staggering 5,094 deaths and 61,097 cases last week made it one of the most devastating weeks for LTC residents and staff yet. covidtracking.com/blog/vaccines-…
Our numbers, while drastic, are an undercount of COVID-19’s severity in long-term-care facilities. Arizona, Missouri, and New York provide incomplete LTC data, and are the largest contributors to the nation’s LTC undercount. covidtracking.com/data/longtermc…
Pennsylvania reported nearly 500 LTC deaths last week, an increase of 55% from the previous week, and about 10% of the total new LTC deaths from COVID-19 in the United States. Bar chart of weekly cases, deaths, and facilities with new o
Read 5 tweets

Did Thread Reader help you today?

Support us! We are indie developers!


This site is made by just two indie developers on a laptop doing marketing, support and development! Read more about the story.

Become a Premium Member ($3/month or $30/year) and get exclusive features!

Become Premium

Too expensive? Make a small donation by buying us coffee ($5) or help with server cost ($10)

Donate via Paypal Become our Patreon

Thank you for your support!

Follow Us on Twitter!