1/X
Those behind the Great Barrington Declaration mention herd immunity as a way to address COVID-19.
So I'll discuss it. After all, noting herd immunity (in response to vaccine deniers) is 1 main reason I started on Twitter.
gbdeclaration.org
Those behind the Great Barrington Declaration mention herd immunity as a way to address COVID-19.
So I'll discuss it. After all, noting herd immunity (in response to vaccine deniers) is 1 main reason I started on Twitter.
https://twitter.com/AtomsksSanakan/status/891040491214688257
gbdeclaration.org

2/X
Suppose u want to know how many people would die from COVID-19 under *baseline conditions*.
So basically: treat COVID-19 like another typical disease, with business-as-usual and acting the same as this time last year without the pandemic.
Suppose u want to know how many people would die from COVID-19 under *baseline conditions*.
So basically: treat COVID-19 like another typical disease, with business-as-usual and acting the same as this time last year without the pandemic.
https://twitter.com/AtomsksSanakan/status/1337238156052226050
3/X
Re: "how many people would die from COVID-19 under *baseline conditions*"
One can figure that out using:
- the number of people who would get infected
- how many of those infected people die of COVID-19
A separate thread on the latter point:
Re: "how many people would die from COVID-19 under *baseline conditions*"
One can figure that out using:
- the number of people who would get infected
- how many of those infected people die of COVID-19
A separate thread on the latter point:
https://twitter.com/AtomsksSanakan/status/1341443629349543937
4/X
The virus infects more people if the virus is more contagious, meaning it has a larger R0.
R0 of 2 implies each infected person infects 2 other people on average, at baseline, before they stop being infectious.
For R0 of 3, they infect 3 others.
Etc
mdpi.com/2076-393X/8/2/…
The virus infects more people if the virus is more contagious, meaning it has a larger R0.
R0 of 2 implies each infected person infects 2 other people on average, at baseline, before they stop being infectious.
For R0 of 3, they infect 3 others.
Etc
mdpi.com/2076-393X/8/2/…

5/X
Eventually, so many people become non-infectious + immune to infection, that the virus struggles to find non-immune people to infect and use to infect other non-immune people.
That's the idea behind herd immunity.
medium.com/@silentn2040/t…
Eventually, so many people become non-infectious + immune to infection, that the virus struggles to find non-immune people to infect and use to infect other non-immune people.
That's the idea behind herd immunity.
medium.com/@silentn2040/t…

6/X
The 'herd immunity threshold' (HIT) is the proportion of people who need to be immune to infection, in order for 'infections per unit time' to stop increasing (i.e. keep R under 1), at baseline.
At HIT, the outbreak is on its way to dying out.
The 'herd immunity threshold' (HIT) is the proportion of people who need to be immune to infection, in order for 'infections per unit time' to stop increasing (i.e. keep R under 1), at baseline.
At HIT, the outbreak is on its way to dying out.
https://twitter.com/AtomsksSanakan/status/1309297907863035904
7/X
The classic calculation for HIT is:
1 - (1 / R0)
So an R0 of 3 implies:
HIT = 1 - (1/3) = 67%
A larger R0 means a larger the HIT.
In other words: a more contagious virus means more people need to be immune to infection for the outbreak to die out.
sciencedirect.com/science/articl…
The classic calculation for HIT is:
1 - (1 / R0)
So an R0 of 3 implies:
HIT = 1 - (1/3) = 67%
A larger R0 means a larger the HIT.
In other words: a more contagious virus means more people need to be immune to infection for the outbreak to die out.
sciencedirect.com/science/articl…

8/X
Different places have different baseline conditions, + thus different values for R0 and HIT.
journalofinfection.com/article/S0163-…
A typical R0 for a western country is ~2.5 or more, implying at HIT of >= 60%. Higher than seasonal flu.
link.springer.com/article/10.118…
thelancet.com/action/showPdf…

9/x
People still get infected after HIT is reached, but not enough to replace the people who become immune after they recover from infection (since R is now less than 1).
This implies "overshoot": the final percentage of people infected is more than HIT
People still get infected after HIT is reached, but not enough to replace the people who become immune after they recover from infection (since R is now less than 1).
This implies "overshoot": the final percentage of people infected is more than HIT
https://twitter.com/CT_Bergstrom/status/1252009362849009664

10/X
So for the question from part 2/X:
How many people would die from COVID-19 under *baseline conditions*?
Ferguson et al. answered this in March, with a HIT of ~58%, and IFR of 0.9% for Great Britain (~0.8% for the USA):
web.archive.org/web/2020042101…
So for the question from part 2/X:
How many people would die from COVID-19 under *baseline conditions*?
Ferguson et al. answered this in March, with a HIT of ~58%, and IFR of 0.9% for Great Britain (~0.8% for the USA):
https://twitter.com/AtomsksSanakan/status/1337273174967394305
web.archive.org/web/2020042101…

11/X
So how does this play out in reality?
Well, a respiratory virus like SARS-CoV-2 that spreads by droplets + aerosols, takes longer to infect a given proportion of people in:
- a larger population
- a population spread over a wider geographical area
So how does this play out in reality?
Well, a respiratory virus like SARS-CoV-2 that spreads by droplets + aerosols, takes longer to infect a given proportion of people in:
- a larger population
- a population spread over a wider geographical area
https://twitter.com/AtomsksSanakan/status/1292997236843057156
12/X
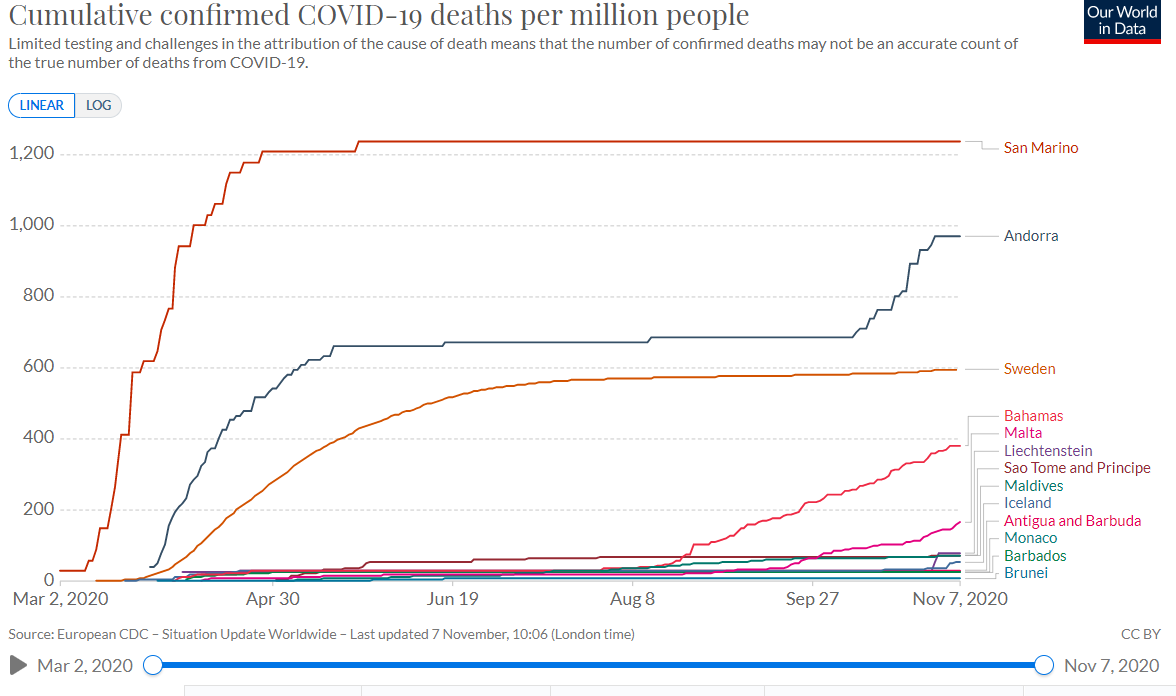
Since SARS-CoV-2 is very contagious (high R0 and therefore high HIT), SARS-CoV-2 then quickly infects a large proportion of people in smaller populations and/or populations covering small areas, before behavior changes and interventions limit spread
Since SARS-CoV-2 is very contagious (high R0 and therefore high HIT), SARS-CoV-2 then quickly infects a large proportion of people in smaller populations and/or populations covering small areas, before behavior changes and interventions limit spread
https://twitter.com/AtomsksSanakan/status/1293007098134044672

13/X
SARS-CoV-2 also infects a higher proportion of people in areas that remain closer to the baseline conditions of R0 (i.e. not much infection-limiting behavior changes and/or public health interventions like mask-wearing).
web.archive.org/web/2020110203…
SARS-CoV-2 also infects a higher proportion of people in areas that remain closer to the baseline conditions of R0 (i.e. not much infection-limiting behavior changes and/or public health interventions like mask-wearing).
https://twitter.com/AtomsksSanakan/status/1323672387121020930
web.archive.org/web/2020110203…

14/X
Larger populations see people dying of COVID-19, and respond with additional behavior changes + public health interventions that push them further from the baseline conditions of R0.
That limits the spread of SARS-CoV-2 and limits COVID-19 deaths.
Larger populations see people dying of COVID-19, and respond with additional behavior changes + public health interventions that push them further from the baseline conditions of R0.
That limits the spread of SARS-CoV-2 and limits COVID-19 deaths.
https://twitter.com/AtomsksSanakan/status/1338578097013219339

15/X
So larger populations and/or populations spread over larger geographic areas, end up with a lower proportion of people infected, even though HIT is high.
Some people see those lower proportion of infected people, and incorrectly infer HIT is low
So larger populations and/or populations spread over larger geographic areas, end up with a lower proportion of people infected, even though HIT is high.
Some people see those lower proportion of infected people, and incorrectly infer HIT is low
https://twitter.com/AtomsksSanakan/status/1283817701316714499

16/X
But remember, it wasn't herd immunity that limited infections into larger populations and regions; those regions didn't reach HIT.
Instead, it was behavior changes and/or public health interventions that limited infections
ncbi.nlm.nih.gov/pmc/articles/P…
But remember, it wasn't herd immunity that limited infections into larger populations and regions; those regions didn't reach HIT.
Instead, it was behavior changes and/or public health interventions that limited infections
https://twitter.com/AtomsksSanakan/status/1337362849820266500
ncbi.nlm.nih.gov/pmc/articles/P…

17/X
I'll make a claim some people may find controversial:
Claiming HIT is very low (ex: ~10% - ~20%) is *dangerous and obviously incorrect.*
In fact, it may be the most dangerous idea to emerge during the COVID-19 pandemic.
I'll make a claim some people may find controversial:
Claiming HIT is very low (ex: ~10% - ~20%) is *dangerous and obviously incorrect.*
In fact, it may be the most dangerous idea to emerge during the COVID-19 pandemic.
https://twitter.com/AtomsksSanakan/status/1337240769732767744
https://twitter.com/AtomsksSanakan/status/1337255624854425600

18/X
Saying we reached a low HIT tells us we no longer need to go beyond *baseline conditions* to prevent infections/day from increasing; i.e. no additional:
- mask-wearing
- avoiding visiting nursing homes + large indoor gathers
- vaccinations
etc.
Saying we reached a low HIT tells us we no longer need to go beyond *baseline conditions* to prevent infections/day from increasing; i.e. no additional:
- mask-wearing
- avoiding visiting nursing homes + large indoor gathers
- vaccinations
etc.
https://twitter.com/AtomsksSanakan/status/1292337005918068736

19/X
Some non-experts and experts claim HIT is low.
Examples of non-experts:
medrxiv.org/content/medrxi…
zerohedge.com/political/whit…
realclimatescience.com/2020/06/no-imm…
off-guardian.org/2020/07/07/sec…
medium.com/@jrfinkel/covi…
judithcurry.com/2020/05/10/why…
judithcurry.com/2020/06/28/the…
Some non-experts and experts claim HIT is low.
Examples of non-experts:
medrxiv.org/content/medrxi…
zerohedge.com/political/whit…
realclimatescience.com/2020/06/no-imm…
off-guardian.org/2020/07/07/sec…
medium.com/@jrfinkel/covi…
https://twitter.com/RandPaul/status/1283753633247563777
judithcurry.com/2020/05/10/why…
judithcurry.com/2020/06/28/the…

20/X
The non-experts have no background in epidemiology, immunology, etc.
So they falsely assume only herd immunity can limit R and thus limit infections per day; i.e. they assume if infections/day and COVID-19 deaths/day decrease, then HIT was reached
archive.is/h96zK#selectio…
The non-experts have no background in epidemiology, immunology, etc.
So they falsely assume only herd immunity can limit R and thus limit infections per day; i.e. they assume if infections/day and COVID-19 deaths/day decrease, then HIT was reached
archive.is/h96zK#selectio…

21/X
But factors other than herd immunity can limit infections and deaths, as covered in part 16/X. So the non-experts are wrong.
You can usually spot these non-experts because they claim Stockholm, Sweden (or New York City, or...) reached HIT.
Yet...
archive.is/CKncm#selectio…
But factors other than herd immunity can limit infections and deaths, as covered in part 16/X. So the non-experts are wrong.
You can usually spot these non-experts because they claim Stockholm, Sweden (or New York City, or...) reached HIT.
Yet...
archive.is/CKncm#selectio…

22/X
So what about experts who claim HIT is low? Probably the most well-known one is Gabriela M. Gomes (@mgmgomes1).
Unlike the non-experts, her team is aware that HIT is about baseline conditions of R0.
medrxiv.org/content/10.110…
medrxiv.org/content/10.110…
So what about experts who claim HIT is low? Probably the most well-known one is Gabriela M. Gomes (@mgmgomes1).
Unlike the non-experts, her team is aware that HIT is about baseline conditions of R0.
https://twitter.com/AtomsksSanakan/status/1337240276356751361
medrxiv.org/content/10.110…
medrxiv.org/content/10.110…

23/X
But the expert proponents of low HIT still need to distinguish the effects of HIT, vs. the effects of behavior changes + public health interventions.
Turns out Gomes' team did that incorrectly.
medrxiv.org/content/10.110…
But the expert proponents of low HIT still need to distinguish the effects of HIT, vs. the effects of behavior changes + public health interventions.
Turns out Gomes' team did that incorrectly.
https://twitter.com/FoxandtheFlu/status/1334546142852337664
medrxiv.org/content/10.110…

24/X
When one better accounts for the effects of behavior changes + public health interventions, HIT is >50% (green), instead of ~10% - ~20% (blue).
Achieving this higher HIT, without a vaccine, would cause more COVID-19 deaths.
medrxiv.org/content/10.110…
When one better accounts for the effects of behavior changes + public health interventions, HIT is >50% (green), instead of ~10% - ~20% (blue).
Achieving this higher HIT, without a vaccine, would cause more COVID-19 deaths.
https://twitter.com/AtomsksSanakan/status/1337217585377660928
medrxiv.org/content/10.110…

25/X
Other sources also support a HIT of >50%, or HIT still not being reached at a >40% infection rate.
web.archive.org/web/2020082310…
web.archive.org/web/2020090113…
"A method is presented for estimating the model parameters from real-world data [...]"
journals.plos.org/plosone/articl…
Other sources also support a HIT of >50%, or HIT still not being reached at a >40% infection rate.
web.archive.org/web/2020082310…
web.archive.org/web/2020090113…
"A method is presented for estimating the model parameters from real-world data [...]"
journals.plos.org/plosone/articl…

26/X
Why think HIT is high?
One reason centers on heterogeneity vs. homogeneity.
Or in layman's terms: differences vs. sameness.
The "HIT = 1 - (1 / R0)" calculation from part 7/X assumes sameness, while low HIT proponents claim large differences.
sciencedirect.com/science/articl…
Why think HIT is high?
One reason centers on heterogeneity vs. homogeneity.
Or in layman's terms: differences vs. sameness.
The "HIT = 1 - (1 / R0)" calculation from part 7/X assumes sameness, while low HIT proponents claim large differences.
sciencedirect.com/science/articl…

27/X
If "heterogeneity vs. homogeneity" is confusing, think of a sexually-transmitted infection (STI) like HIV.
With STIs, heterogeneity is high (so large differences virus transmission interactions).
cambridge.org/core/services/…
archive.is/qBEuG#selectio…
If "heterogeneity vs. homogeneity" is confusing, think of a sexually-transmitted infection (STI) like HIV.
With STIs, heterogeneity is high (so large differences virus transmission interactions).
https://twitter.com/bansallab/status/1259970552074207238
cambridge.org/core/services/…
archive.is/qBEuG#selectio…

28/X
But SARS-CoV-2, the virus that causes the disease COVID-19, isn't an STI. It's a respiratory virus spread by droplets + aerosols, using behaviors more common to everyone, such as breathing + face-touching
So there's more sameness (i.e. homogeneity)
quantamagazine.org/the-tricky-mat…
But SARS-CoV-2, the virus that causes the disease COVID-19, isn't an STI. It's a respiratory virus spread by droplets + aerosols, using behaviors more common to everyone, such as breathing + face-touching
So there's more sameness (i.e. homogeneity)
quantamagazine.org/the-tricky-mat…

29/X
Ironically, many non-experts try to lecture me on how heterogeneity (differences) are large for SARS-CoV-2, when they know less about this than me. 🤦♂️
Highlights in tweets in part 30/X onwards, in case they try this on you.
Ironically, many non-experts try to lecture me on how heterogeneity (differences) are large for SARS-CoV-2, when they know less about this than me. 🤦♂️
Highlights in tweets in part 30/X onwards, in case they try this on you.
https://twitter.com/VicenteAriztia/status/1289397995092484096
https://twitter.com/AtomsksSanakan/status/891040491214688257

30/X
Different T cell responses between people won't give enough heterogeneity to greatly lower HIT, especially since T cells are not primarily involved in limiting infections. They're more about responding after infection.
Different T cell responses between people won't give enough heterogeneity to greatly lower HIT, especially since T cells are not primarily involved in limiting infections. They're more about responding after infection.
https://twitter.com/profshanecrotty/status/1309170532965920769
https://twitter.com/AtomsksSanakan/status/1309311345947484166

31/X
In layman's terms: cross-reactivity involves the immune system treating SARS-CoV-2 like another virus the immune system previously responded to, such as another coronavirus.
Cross-reactivity isn't going to drop HIT by a lot
nature.com/articles/s4157…
In layman's terms: cross-reactivity involves the immune system treating SARS-CoV-2 like another virus the immune system previously responded to, such as another coronavirus.
Cross-reactivity isn't going to drop HIT by a lot
https://twitter.com/AtomsksSanakan/status/1312654302742183936
nature.com/articles/s4157…

32/X
There are transmission differences, such as medical professionals generating aerosols when they intubate people (i.e. place tube down their throat), placing those professionals at more risk from SARS-CoV-2-containing aerosols.
web.archive.org/web/2020122322…
There are transmission differences, such as medical professionals generating aerosols when they intubate people (i.e. place tube down their throat), placing those professionals at more risk from SARS-CoV-2-containing aerosols.
web.archive.org/web/2020122322…

33/X
But these differences occur for other respiratory viruses such as influenza, w/o causing a much lower-than-expected HIT.
Other pertinent differences are likely already included in R0 (see parts 28/X and 31/X).
archive.is/8MiEc#selectio…
But these differences occur for other respiratory viruses such as influenza, w/o causing a much lower-than-expected HIT.
Other pertinent differences are likely already included in R0 (see parts 28/X and 31/X).
https://twitter.com/AdamJKucharski/status/1294985964801142784
archive.is/8MiEc#selectio…

34/X
There isn't perfect sameness (perfect homogeneity).
But it's homogenous enough for a high HIT + to have "HIT = 1 - (1 / R0)" from part 7/X be a decent approximation, consistent with the high infection rates from 12/X + 13/X
medrxiv.org/content/10.110…
There isn't perfect sameness (perfect homogeneity).
But it's homogenous enough for a high HIT + to have "HIT = 1 - (1 / R0)" from part 7/X be a decent approximation, consistent with the high infection rates from 12/X + 13/X
https://twitter.com/AtomsksSanakan/status/1339263966678224897
medrxiv.org/content/10.110…

35/X
Proponents of low HIT also predicted areas with high infection rates wouldn't have strong second waves.
They were wrong (another example in part 21/X).
archive.is/m8e89#selectio…
Proponents of low HIT also predicted areas with high infection rates wouldn't have strong second waves.
They were wrong (another example in part 21/X).
https://twitter.com/OYCar/status/1318386897660518401
https://twitter.com/akcayerol/status/1318376173177606151
https://twitter.com/mikejohansenmd/status/1320453089875447810
archive.is/m8e89#selectio…
https://twitter.com/thomdvorak/status/1319657564003500032

36/X
Gomes' low HIT framework predicted places with higher infection fatality rates would have lower infection rates.
That didn't consistently hold up.
mdpi.com/2079-7737/9/6/…
web.archive.org/web/2020083021…
Gomes' low HIT framework predicted places with higher infection fatality rates would have lower infection rates.
That didn't consistently hold up.
https://twitter.com/mgmgomes1/status/1310944207901687810
mdpi.com/2079-7737/9/6/…
web.archive.org/web/2020083021…
https://twitter.com/AtomsksSanakan/status/1333154830962094088
https://twitter.com/GidMK/status/1277804390603059201

37/X
The observed pattern of infections and COVID-19 deaths better fit one would expect from behavior changes + public health interventions limiting infections, not herd immunity (with a low HIT) limiting infections, as per part 16/X.
ncbi.nlm.nih.gov/pmc/articles/P…
The observed pattern of infections and COVID-19 deaths better fit one would expect from behavior changes + public health interventions limiting infections, not herd immunity (with a low HIT) limiting infections, as per part 16/X.
ncbi.nlm.nih.gov/pmc/articles/P…

38/X
There are other region-specific reasons to think particular regions did not reach a low HIT. I've covered some elsewhere:
medium.com/@silentn2040/t…
There are other region-specific reasons to think particular regions did not reach a low HIT. I've covered some elsewhere:
https://twitter.com/AtomsksSanakan/status/1282213024905015298
medium.com/@silentn2040/t…

39/X
So some reasons for thinking the herd immunity threshold is high:
- the biology underlying transmission of respiratory viruses
- high infection rates
- second waves
- higher fatality rates at higher infection rates
etc.
And I've see no good reason to think HIT is very low
So some reasons for thinking the herd immunity threshold is high:
- the biology underlying transmission of respiratory viruses
- high infection rates
- second waves
- higher fatality rates at higher infection rates
etc.
And I've see no good reason to think HIT is very low
40/X
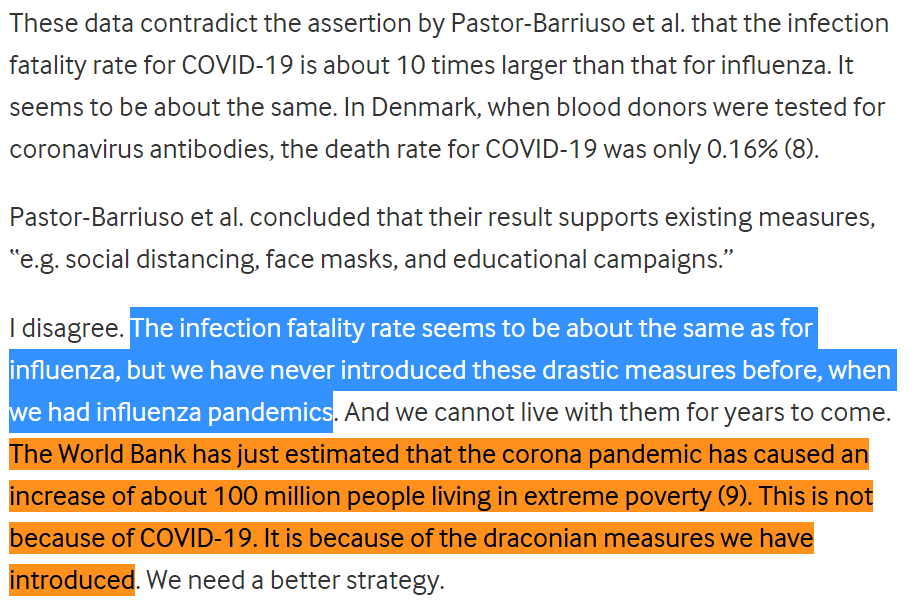
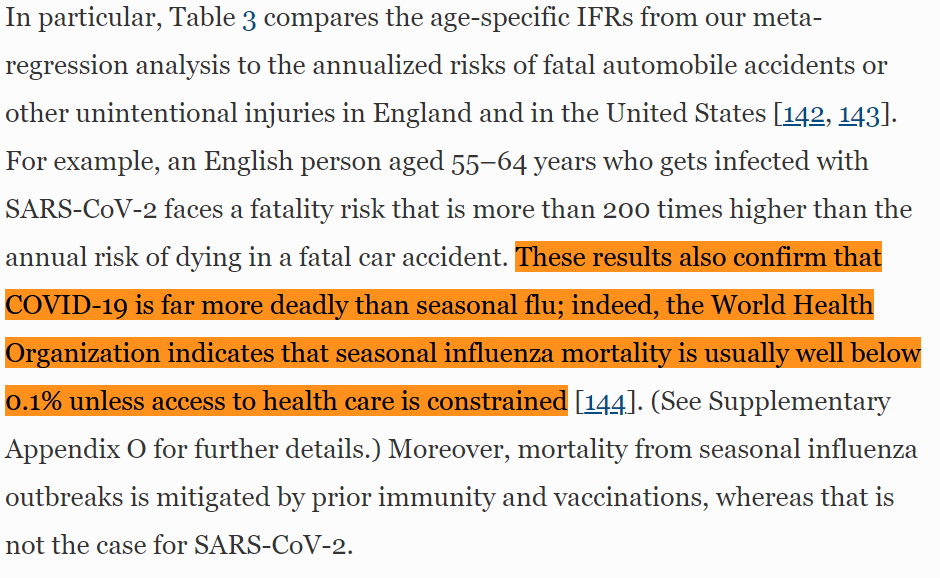
Some folks claim HIT is low, b/c it allows them to downplay how dangerous COVID-19 is + thus avoid policies they dislike (like lockdowns).
Hence why many of the same people who suggest HIT is low, also under-estimated SARS-CoV-2's fatality rate. 🤷♂️
Some folks claim HIT is low, b/c it allows them to downplay how dangerous COVID-19 is + thus avoid policies they dislike (like lockdowns).
Hence why many of the same people who suggest HIT is low, also under-estimated SARS-CoV-2's fatality rate. 🤷♂️
https://twitter.com/AtomsksSanakan/status/1314397925016064000

41/X
Also, other factors can increase HIT.
For example: people not becoming immune to infection after they're infected. The "HIT = 1 - (1 / R0)" calculation assumes persistent immunity after infection, as per part 26/X.
archive.is/Xjyec#selectio…
Also, other factors can increase HIT.
For example: people not becoming immune to infection after they're infected. The "HIT = 1 - (1 / R0)" calculation assumes persistent immunity after infection, as per part 26/X.
https://twitter.com/AtomsksSanakan/status/1316757724387041285
archive.is/Xjyec#selectio…

42/X
Though SARS-CoV-2 is more contagious than seasonal influenza (i.e. higher R0), other factors slow its spread. That gives larger populations more time to use public health interventions + behavior changes to slow its spread, as per parts 11/X to 16/X
who.int/docs/default-s…
Though SARS-CoV-2 is more contagious than seasonal influenza (i.e. higher R0), other factors slow its spread. That gives larger populations more time to use public health interventions + behavior changes to slow its spread, as per parts 11/X to 16/X
who.int/docs/default-s…

43/X
Re: "Some folks claim HIT is low, b/c it allows them to downplay how dangerous COVID-19 is + thus avoid policies they dislike (like lockdowns)"
The Great Barrington Declaration is a vehicle for that
cell.com/med/fulltext/S…
Re: "Some folks claim HIT is low, b/c it allows them to downplay how dangerous COVID-19 is + thus avoid policies they dislike (like lockdowns)"
The Great Barrington Declaration is a vehicle for that
https://twitter.com/FoxandtheFlu/status/1334546126880395264
cell.com/med/fulltext/S…
https://twitter.com/mgmgomes1/status/1316485064046280708

• • •
Missing some Tweet in this thread? You can try to
force a refresh