1/ New PHE technical report on B.1.1.7 variant assets.publishing.service.gov.uk/government/upl…
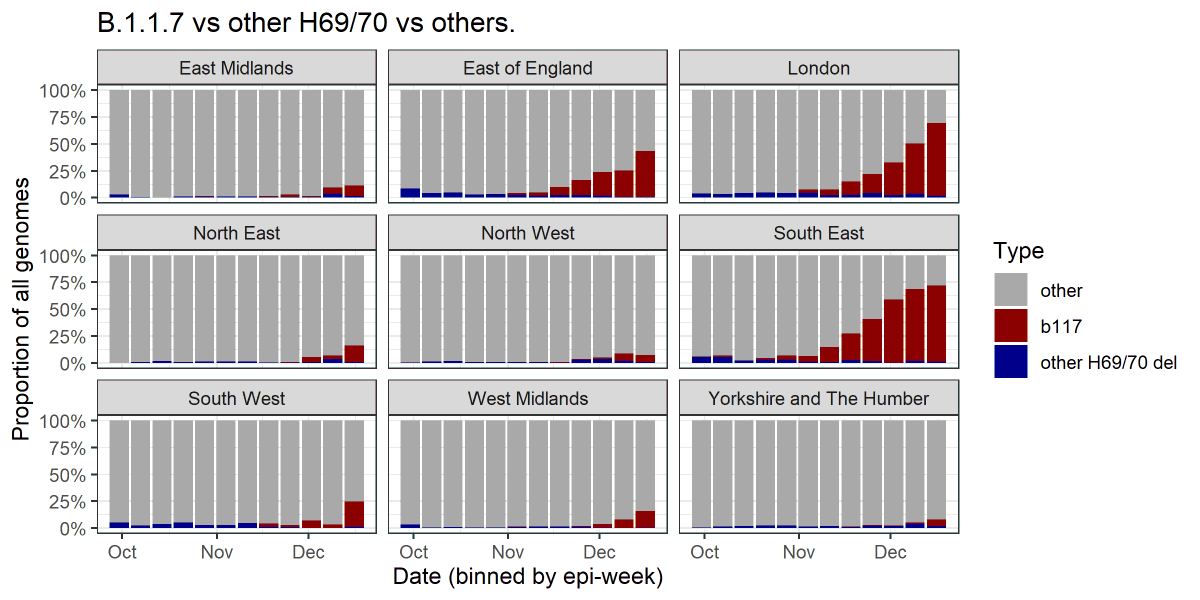
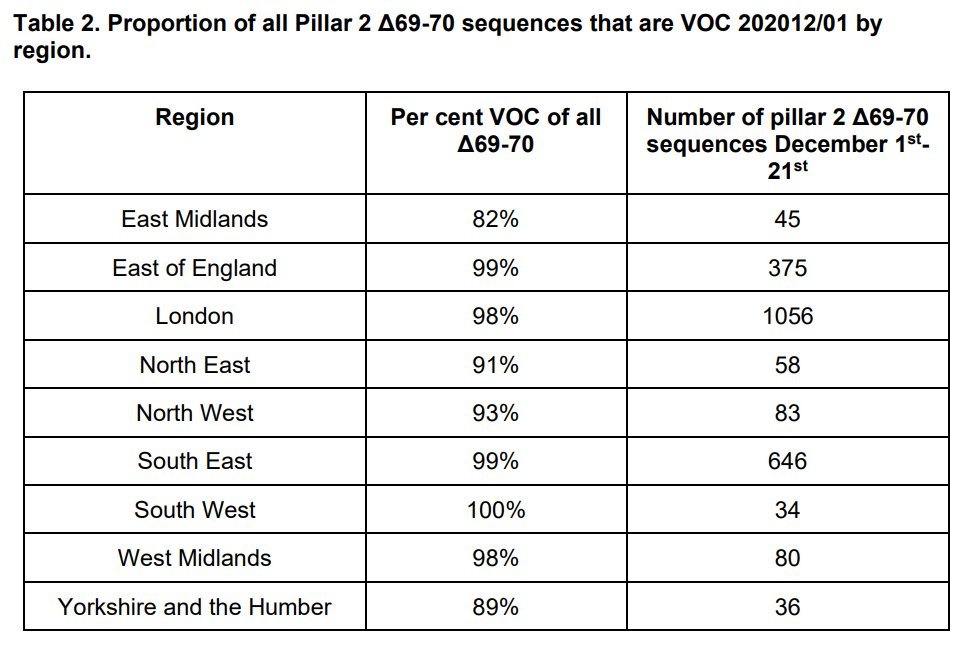
2/ S dropout now appears a very good indication of B.1.1.7 in all regions. 
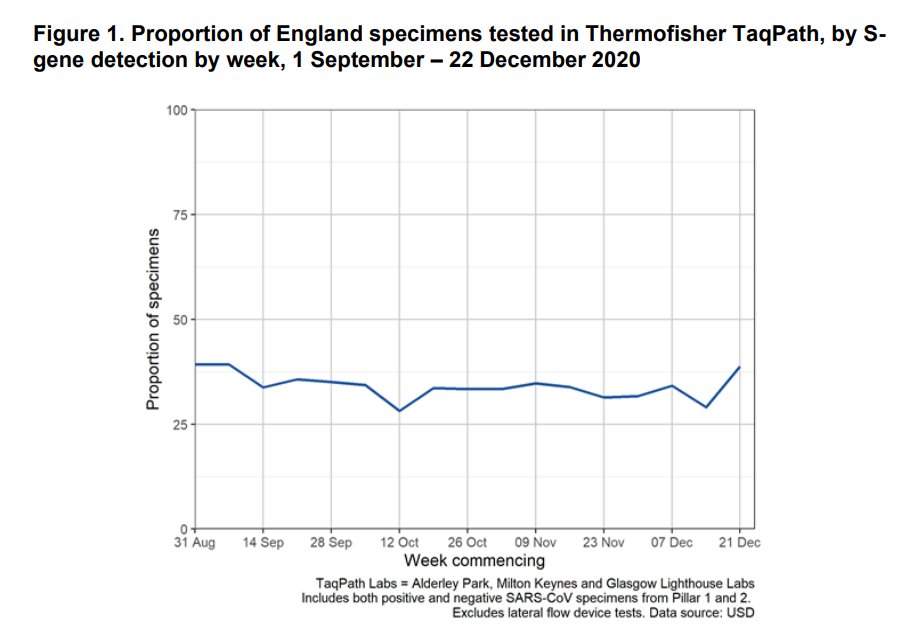
3/ Roughly a third of swab tests are carried out with the TaqPath assay that serendipitously allows this S dropout detection of B.1.1.7.
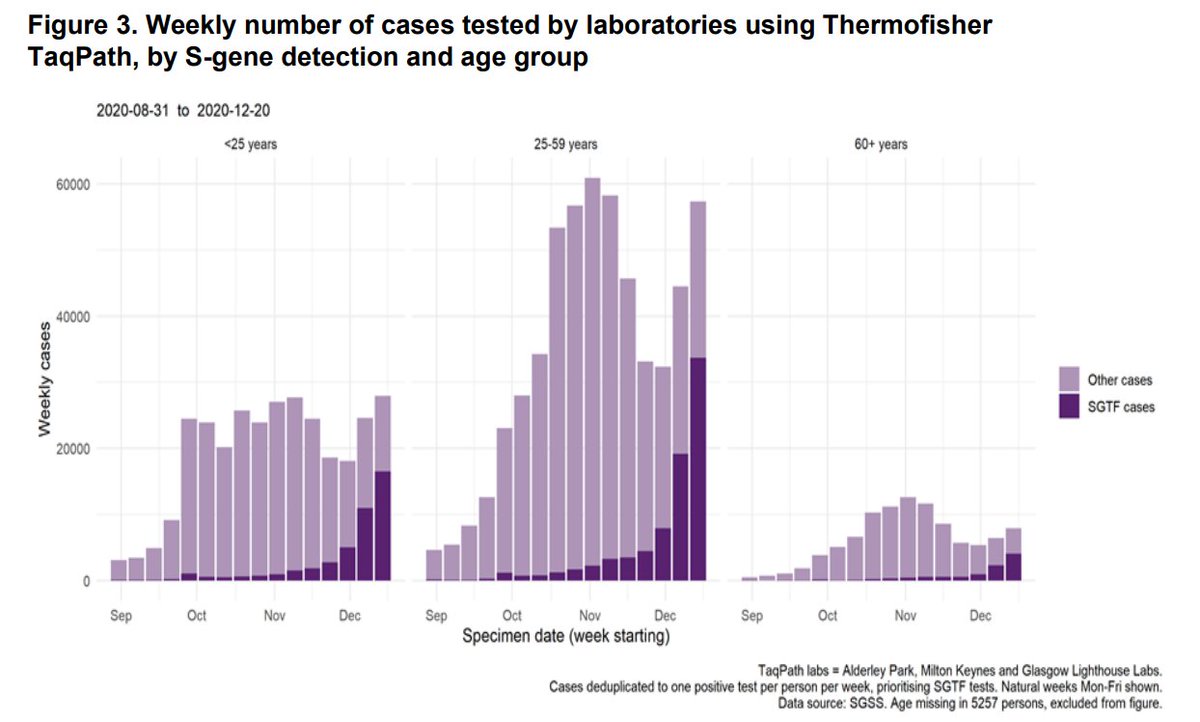
4/ Rapid increase in proportion of tests showing S dropout 'in all age groups though most markedly in persons aged 25-49 years'
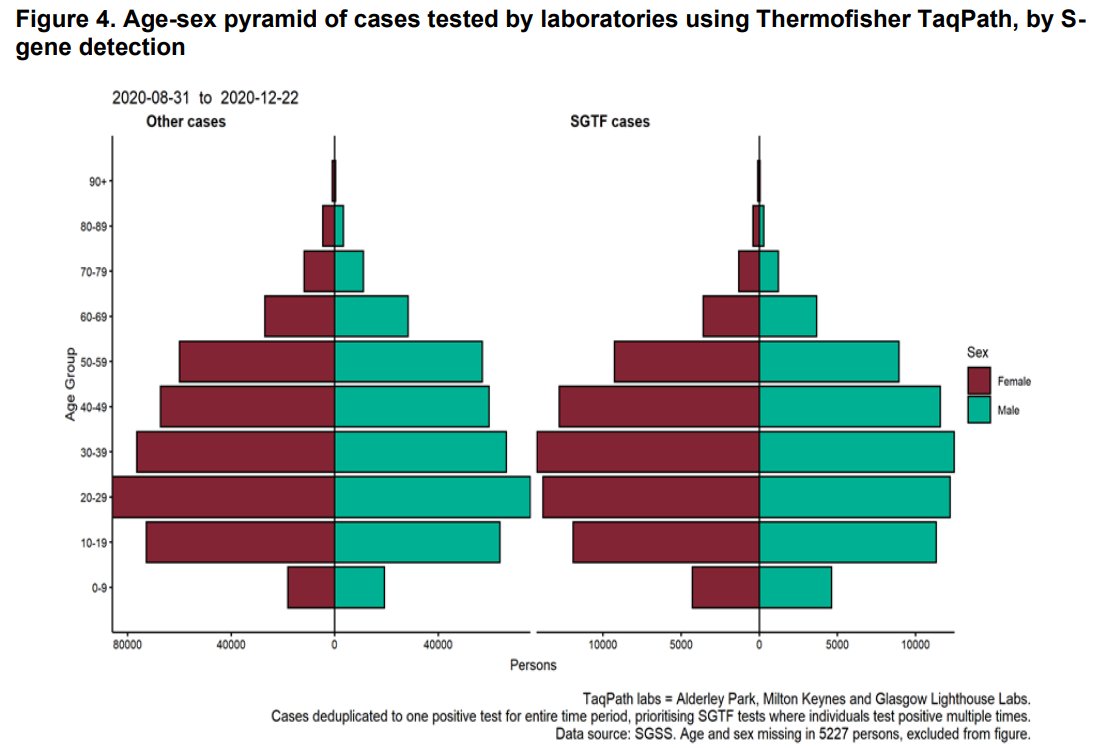
5/ Age pyramids showing the same effect
6/ There's a big analysis where they take "matched" samples of B.1.1.7 vs. other variants and find for the most part few statistically detectable differences. I'm cautious here, as if variant gave e.g. both more symptomatic cases & more hospitalisations this wld be hard to detect
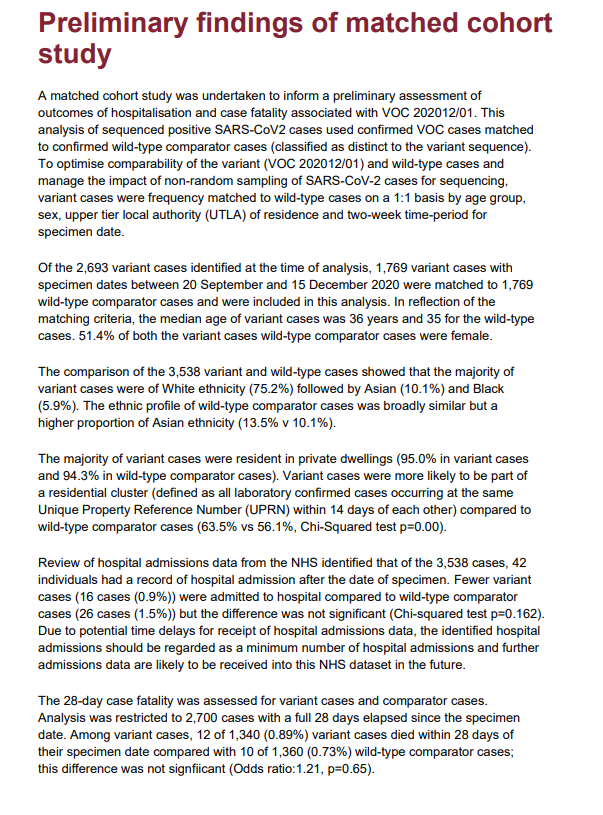
7/ No differences seen in reinfections (small N in each case)
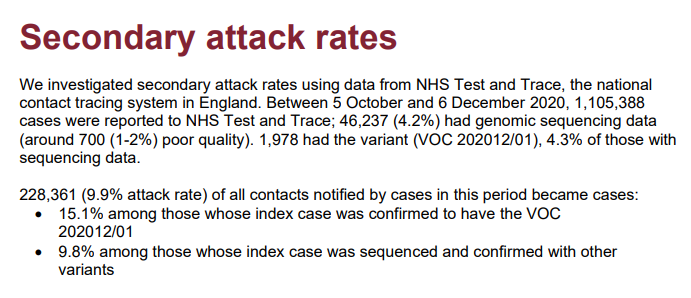
8/ Big increase seen in secondary attack rate, consistent with increased transmission (And an impressively powered analysis)
But I guess there will also be e.g. geographical differences in where the variant is and isn't which one would need to control for (hopefully they have)
But I guess there will also be e.g. geographical differences in where the variant is and isn't which one would need to control for (hopefully they have)
9/ It does strike me that for a lot of these effects (e.g. age) there is potential for Simpson's paradox like effects
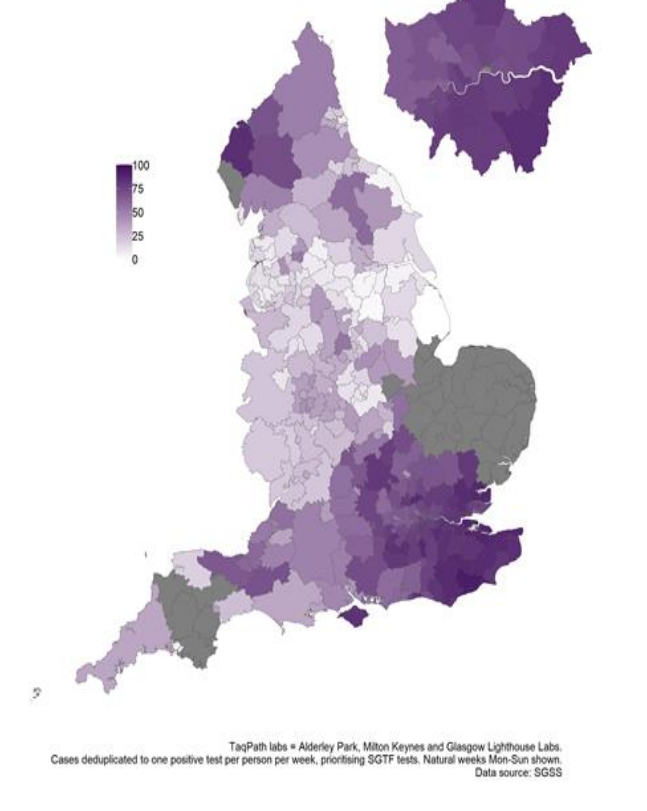
10/ Geographical map of S dropout. Would be surprised if Cumbria doesn't move up the tiers soon (cases surging in Eden). Some areas in E and SW (gray) where we don't have much data due to samples not being analysed with TaqPath for the most part.
• • •
Missing some Tweet in this thread? You can try to
force a refresh