1/n Recent paper presents evidence that research that reflects negatively on same-sex parenting is less likely to be cited. Would love to see more studies like this, particularly of the racial bias literature... europeansocietyofmedicine.org/index.php/imr/…
2/n We already have some evidence that studies finding no anti-black bias are less likely to be published journals.sagepub.com/doi/pdf/10.117…. And I suspect those demonstrating bias are also less likely to be cited than those that do.
3/n And this is just one reason why we should be skeptical of the 'consensus' @roderickgraham that likes to proclaim on questions of group differences
4/n bleh, typo in 3rd tweet. I meant to say: 'those demonstrating no bias are less likely to be cited than those that do'*.
• • •
Missing some Tweet in this thread? You can try to
force a refresh
1/n Spending Christmas working on my dissertation (because apart from eating Chinese, what else is a Jew supposed to do?). Here's a graph I'm including in the current chapter.
2/n Note that almost all of the change comes not from rating blacks more favorably/unfavorably, but from rating whites more favorably (conservatives)/unfavorably (liberals).
3/n Here's another plot for reverse-coded 'racial resentment' (which I'd argue is more of a measure of perceptions of discrimination and racial sympathy. In other data, it is much more strongly correlated with both white shame and guilt than feelings towards blacks).
), I thought I'd thread graphs of some of the data I found interesting
2/n First, I found it interesting that even when both refugee groups were described as being likely to overwhelmingly vote democrat, white dem participants still favored admitting (unskilled) Venezuelan over Ukranian refugees by a 16.4 point margin (p=0.039).
3/n The inverse is true for republicans, who favor likely republican voting Ukranian to Venezuelan refugees by a 12.4 point margin (though the diff falls short of significance, p=0.104)
1/n Suggestion: One of the advantages of a federalist system is it allows for 'policy experimentation'--new policies can be tested at the local or state-level. If those policies are deemed successful, other states can adopt and test them out in their own..
2/n contexts. Ultimately, this builds a body of evidence indicating whether a policy is likely to succeed (or fail) if implemented at the national level. Thus, Progressives who claim that only their policies can 'save us' should bolster their case by testing them and seeing..
3/n if they actually deliver the predicted results across a diverse set of cultural and economic contexts...lest they bring the entire country down with them.
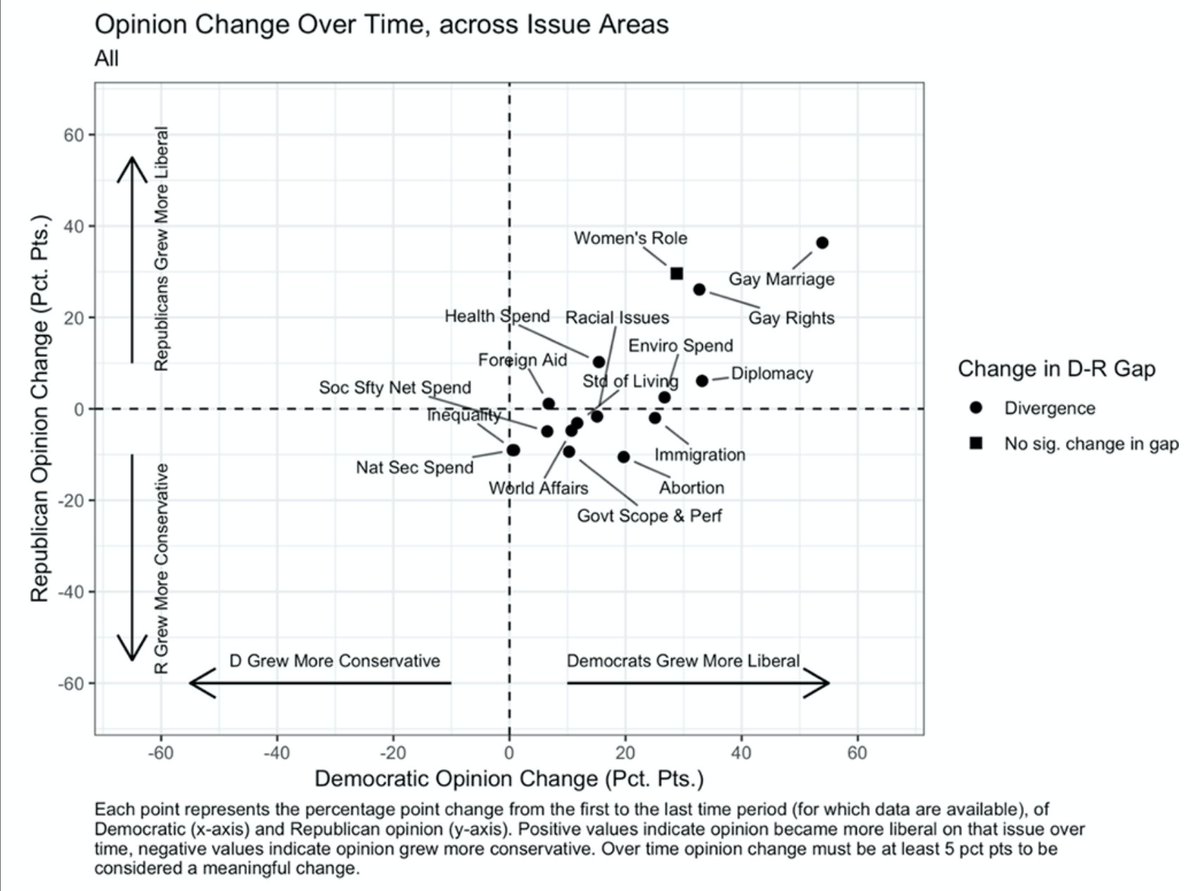
This comports with what I've generally observed in my research on race and immigration attitudes: it's not that the avg. Republican has gotten all that more conservative (of course, you will find exceptions) on the issues. It's rather that Dems have moved much more quickly..
1/n The percent of blacks and hispanics who say they've personally experienced discrimination 'regularly' or 'from time to time' jumped almost 20 points between 2016 and 2020.
2/n Hmmm....🤔
3/n For more on why self-reported measures of discrimination are suspect, see here
1/n Fascinating. Very conservative whites take more prescription drugs, on average, than all other ideological subgroups. However, when controlling for age (because older people-->more medication), the pattern reverses and very liberal whites pull ahead...
2/n No mental health questions, but if I had to guess...
3/n The initial graph was designed to maximize the visibility of the age-adjusted results-reversal (not the size of the differences between groups). But I've been receiving criticism for not beginning the y-axis at 0, so here is a graph that does so