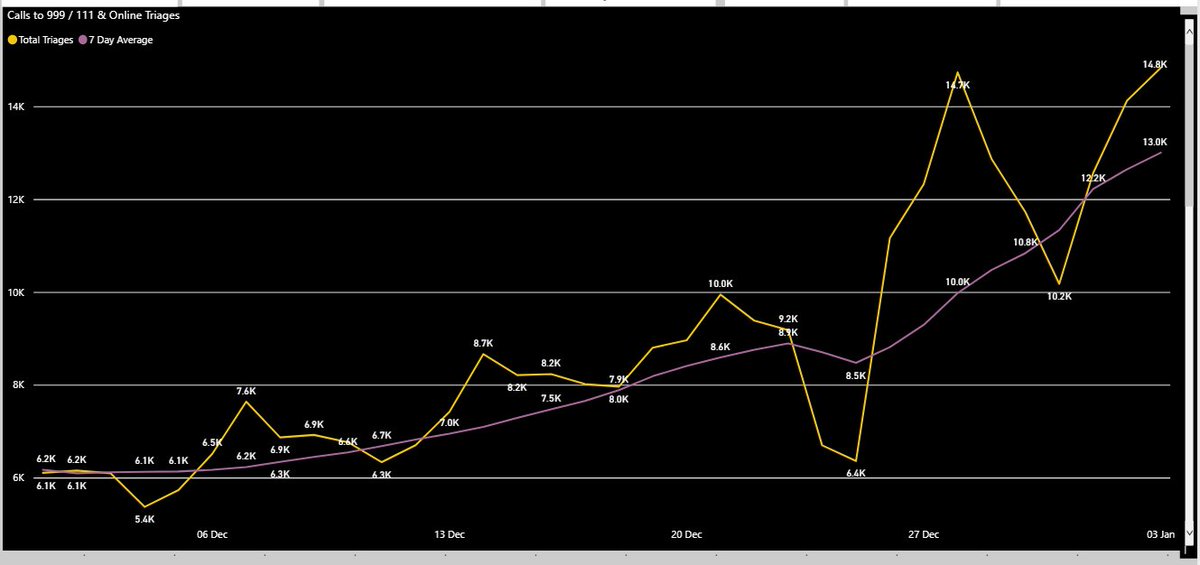
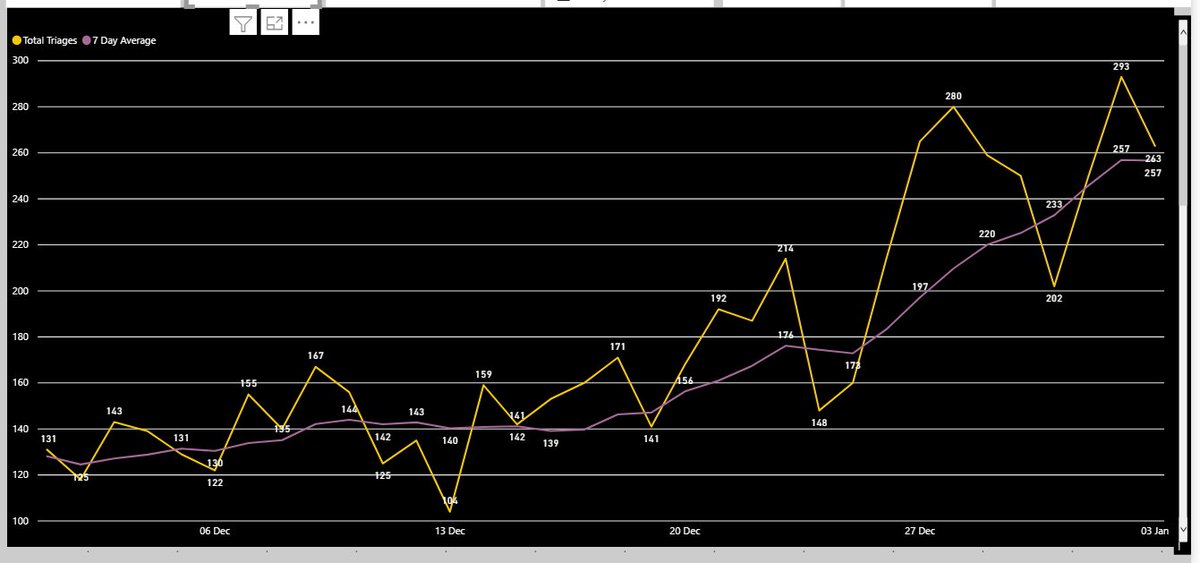
Tested and Positivity by date.

1/ Manchester
2/ Newcastle
3/ Havering
4/ South Lakeland

• • •

Missing some Tweet in this thread? You can try to force a refresh
 

Keep Current with datatosee.com

datatosee.com Profile picture

Stay in touch and get notified when new unrolls are available from this author!

Read all threads

This Thread may be Removed Anytime!

PDF

Twitter may remove this content at anytime! Save it as PDF for later use!

Try unrolling a thread yourself!

how to unroll video
  1. Follow @ThreadReaderApp to mention us!

  2. From a Twitter thread mention us with a keyword "unroll"
@threadreaderapp unroll

Practice here first or read more on our help page!

More from @dontbetyet

4 Jan
1/ Triage data thread with COVID-19 like symptoms. With the recent positivity data that has shot up I was expecting to see a much higher climb in these numbers similar to the September climb. Image
2/ This is a more focused view, from December. Image
3/ This is just 999 calls. Image
Read 9 tweets
4 Jan
1/ Positivity spikes! As shown yesterday the positivity rates have increased massively over the past few days of data (to the 29th December)

What I am struggling to understand / process is the massive spike in low population density areas. Below is data for six North West LA's Image
Carlisle has increased 151% in 10 days it is the 4th highest in the region. In the previous peak it went to 7.7.

A place "Harder hit" previously, Ribble valley. Previous high 15.2 but now above that to 16.7.

So if this is the new strain there seems little immunity to it?
As the case rates have massively increased then we should be seeing this translate into hospital admissions. Depending on age / health this would happen from 2 days after symptoms. The case data is from the 29th so must have had symptoms 28th or prior to get a test on 29th
Read 6 tweets
3 Jan
1/ @_RobbieMoore there has been talk over the past few days of teachers getting priority access to vaccines. This simply cannot happen at the expense of care home residents. These are the numbers of care home residents dying each week with COVID-19 (ONS Data)
2/ Life expectancy of a care home resident is between 12 and 14 months. Many will be dying without seeing family since March or before due to not being allowed visitors. Have these people and their family's not suffered enough.

bgs.org.uk/resources/end-….
3/ A teacher is at no greater risk than other key workers according to the ONS data. Yet we know care home residents are at massive risk. To prioritise teachers would lead to the continued high death rates in care homes. That cannot be acceptable.

theguardian.com/education/2020…
Read 4 tweets
1 Jan
COVID-19 Hospital round up. All charts are the daily percentage change to the 7 day average.

1/ Admissions from the community, big increase in the south west, but had much lower numbers than other places to start with. Image
2/ All COVID-19 admissions by region Image
3/ All COVID Admissions England. Image
Read 5 tweets
24 Dec 20
1/

Schools Thread. Cumulative deaths per million.

Hungary - We closed Schools November 10th
2/

Poland - We closed schools 4th November
3/ Czechia - we closed schools 14th October
Read 7 tweets
22 Dec 20
Hospital round up. All data is the daily percentage change in the 7 day rolling average.

1/ Community admissions.
2/ All admissions
3/ In hospital
Read 5 tweets

Did Thread Reader help you today?

Support us! We are indie developers!


This site is made by just two indie developers on a laptop doing marketing, support and development! Read more about the story.

Become a Premium Member ($3/month or $30/year) and get exclusive features!

Become Premium

Too expensive? Make a small donation by buying us coffee ($5) or help with server cost ($10)

Donate via Paypal Become our Patreon

Thank you for your support!

Follow Us on Twitter!