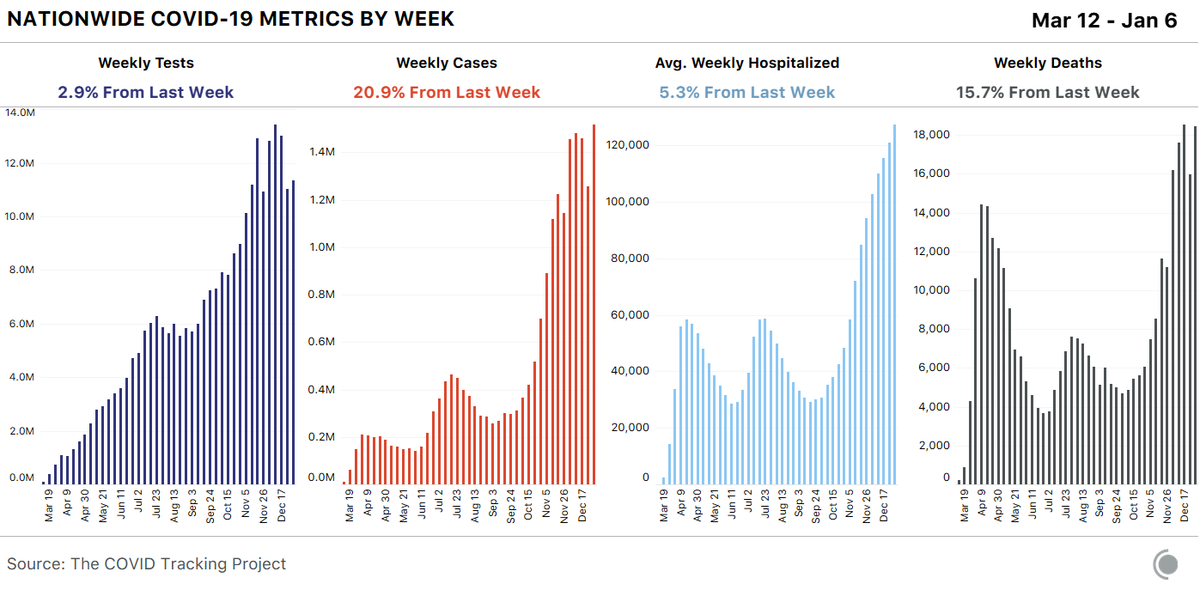
Our daily update is published. States reported 1.9M tests, 266k cases, 132,370 COVID-19 hospitalizations, and a record 4,033 deaths. The 7-day average for deaths is now over 2,750, also a record. Four charts, showing the na...
California, Florida, and Texas alone reported 80 thousand cases today. 3 charts showing cases in C...
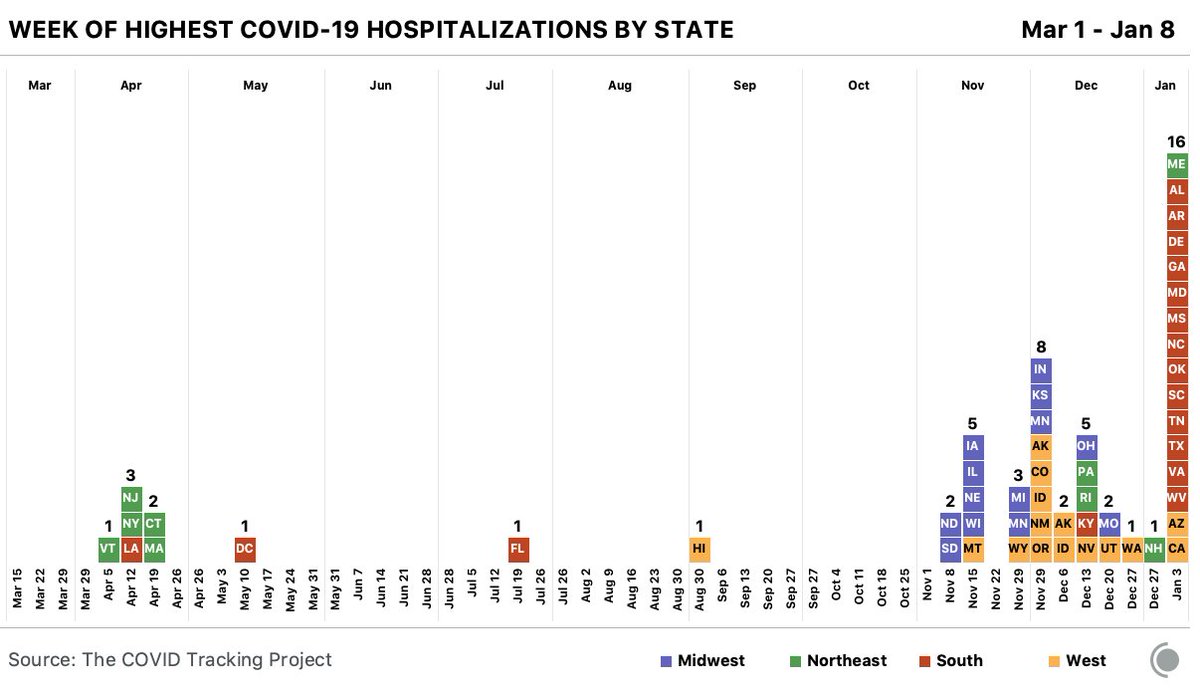
But some small states have severe problems, too. Alabama, Arizona, and Nevada have very high hospitalization rates per capita. Hex map showing the number ...
California alone is now reporting 380 deaths per day on average, including 583 just today. Four charts, showing the da...

• • •

Missing some Tweet in this thread? You can try to force a refresh
 

Keep Current with The COVID Tracking Project

The COVID Tracking Project Profile picture

Stay in touch and get notified when new unrolls are available from this author!

Read all threads

This Thread may be Removed Anytime!

PDF

Twitter may remove this content at anytime! Save it as PDF for later use!

Try unrolling a thread yourself!

how to unroll video
  1. Follow @ThreadReaderApp to mention us!

  2. From a Twitter thread mention us with a keyword "unroll"
@threadreaderapp unroll

Practice here first or read more on our help page!

More from @COVID19Tracking

9 Jan
Our daily update is published. States reported 2.1M tests, a record 310k cases, 131,889 COVID-19 hospitalizations, and 3,777 deaths. The 7-day averages for cases, hospitalizations, and deaths are at record highs. 4 bar charts showing key CO...
NJ reported nearly 20K probable COVID-19 cases and CA reported over 50K cases. Both states greatly influenced the large uptick in today's total cases.
16 states reported their highest number of COVID-19 hospitalizations this week. Chart showing the week duri...
Read 6 tweets
7 Jan
Our weekly update is published.

covidtracking.com/analysis-updat…
In the first week of 2021, US states and territories reported more cases of COVID-19 than at any point in the pandemic so far, the second-highest number of deaths, and the most people currently hospitalized. Four bar charts showing key...
38% of the nation’s COVID-19 deaths in 2020 were among long-term-care residents and staff. December was the deadliest month in long-term-care facilities since we began tracking the data in May. Four bar charts showing key...
Read 5 tweets
6 Jan
Our daily update is published. States reported 1.6M tests, 214k cases, a record 131,195 COVID-19 patients, and 3,478 deaths. 4 bar charts showing key COVID-19 metrics for the US over ti
We are almost at our 7-day average peaks for cases and deaths. The next few days are likely to be worse, as the pandemic continues to rage across most of the country and states catch up on posting holiday-delayed data.
Hospitalizations in the South and West are now worse than the Midwest's peak. And the East is close and rising, too. 4 charts showing hospitalizations per million in the Northea
Read 4 tweets
5 Jan
Our daily update is published. States reported 1.6 million tests, 178k cases, a record 128,210 people hospitalized, and 1,545 COVID-19 deaths. The ongoing holiday effects are reflected in these figures. 4 bar charts showing key COVID-19 metrics for the US over ti
The holidays have had a major impact on testing data. As a result, testing is falling in 33 states across the US. Daily bar chart of COVID-19 tests in the US with 7-day avera
Despite testing data dropping, the 7-day average for COVID-19 cases is higher than pre-holiday figures and increasing in many states across the US. Daily bar chart of COVID-19 cases in the US with 7-day avera
Read 5 tweets
2 Jan
Our daily update is published. States reported 1.2 million tests, 173k cases, 125,057 people hospitalized, and 2,534 COVID-19 deaths. More than 20 states did not provide complete data today. Four charts, showing the daily tests, daily cases, daily dea
As you can see here, there is a mix of states reporting very high numbers, probably due in part to backlogs, and other states reporting nothing for the day. Hex map showing the number of new cases per million resident
California reported 585 deaths today. Before today, New York and Pennsylvania were the only states to have reported more than 500 deaths in a day.

CA, the most populous state, now also has more people hospitalized than NY did at the spring peak. Four charts, showing California’s daily tests, daily cases
Read 4 tweets
1 Jan
Our daily update is published. States reported 1.7 million tests, 221k cases, a record 125,379 people hospitalized, and 3,255 COVID-19 deaths. Four charts, showing the daily tests, daily cases, daily dea
Holiday reporting delays are still markedly affecting testing, case, and deaths figures. Of our four topline metrics, only hospitalizations counts remain relatively stable through holiday data disruptions.

covidtracking.com/analysis-updat… Map showing the number of people currently hospitalized per
Even with all the data pipeline disruptions, every week in December saw more deaths from COVID-19 than any week earlier in the year. December was the deadliest month of the pandemic by far. The 76,580 reported deaths in the month surpassed the heights of April (55,267). 4 bar charts showing tests, cases, hospitalizations, and dea
Read 4 tweets

Did Thread Reader help you today?

Support us! We are indie developers!


This site is made by just two indie developers on a laptop doing marketing, support and development! Read more about the story.

Become a Premium Member ($3/month or $30/year) and get exclusive features!

Become Premium

Too expensive? Make a small donation by buying us coffee ($5) or help with server cost ($10)

Donate via Paypal Become our Patreon

Thank you for your support!

Follow Us on Twitter!