Phil Kerpen Profile picture
15 Jan, 6 tweets, 3 min read
United States Influenza testing, week 1.

CDC flu view. cdc.gov/flu/weekly/ind…

Five-year average: 6,814 cases, 16.90% positive
This year: 107, 0.27%

docs.google.com/spreadsheets/d…
United States Influenza testing, season to date (15 weeks, 40 to 1)

Five-year average: 40,264 cases, 9.90% positive
This year: 1275, 0.19%
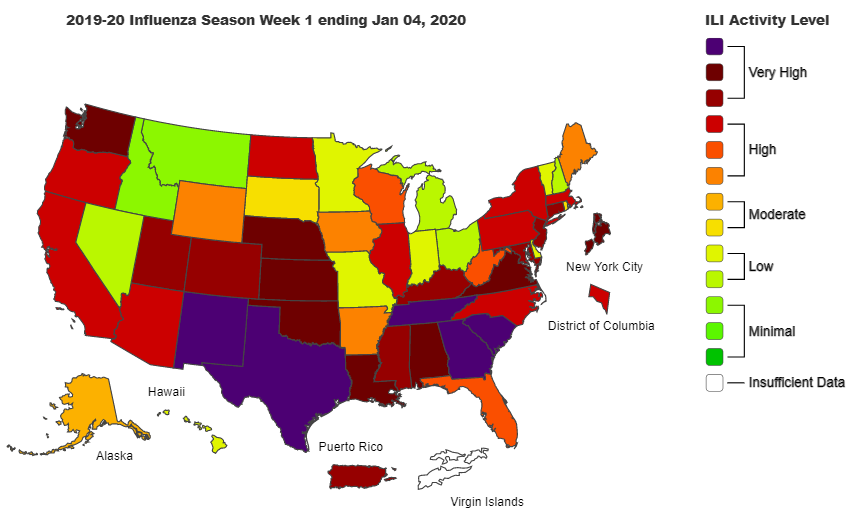
Influenza-Like Illness (ILI) continues to track lower than the mild 2015-16 season.
Still not enough flu for CDC to run its hospitalization model.
Still just one U.S. pediatric flu death this season.
Influenza-Like Illness (ILI) Map

Week 1 2021 vs 2020

• • •

Missing some Tweet in this thread? You can try to force a refresh
 

Keep Current with Phil Kerpen

Phil Kerpen Profile picture

Stay in touch and get notified when new unrolls are available from this author!

Read all threads

This Thread may be Removed Anytime!

PDF

Twitter may remove this content at anytime! Save it as PDF for later use!

Try unrolling a thread yourself!

how to unroll video
  1. Follow @ThreadReaderApp to mention us!

  2. From a Twitter thread mention us with a keyword "unroll"
@threadreaderapp unroll

Practice here first or read more on our help page!

More from @kerpen

17 Jan
This is so important. If you're over 65 (or under but medically high risk) and test positive GET THE ANTIBODY DRIP. If your doctor doesn't know anywhere to get it, call hospitals/infusion centers around town until you find it. This is ridiculous.
This is who qualifies for the antibody infusion: Image
For my local friends, we have a large antibody infusion center now at Washington Hospital Center! Spread the word.
Read 5 tweets
17 Jan
NATURE: "We tested 690 respiratory samples from the 129 patients for the presence of infectious virus using cell culture and determined the viral RNA load with RT-qPCR (Fig. 1). Infectious SARS-CoV-2 was isolated from 62 respiratory tract samples (9.0%) of 23 patients (17.8%)." Image
"The median time of infectious virus shedding was 8 days post onset of symptoms (IQR 5–11, range 0–20) and probit analysis showed a probability of ≤5% for isolating infectious SARS-CoV-2 when the duration of symptoms was 15.2 days (95% CI 13.4–17.2) or more." Image
"The median viral load was significantly higher in culture positive samples than in culture negative samples (8.14 versus 5.88 Log10 RNA copies/mL, p < 0.0001) and the probability of isolating infectious SARS-CoV-2 was less than 5% when the viral load was below 6.63."
Read 6 tweets
4 Jan
United States Influenza testing, week 52.

CDC flu view. cdc.gov/flu/weekly/ind…

Five-year average: 17.44% positive
This year: 0.21%

docs.google.com/spreadsheets/d… Image
United States Influenza testing season-to-date (13 weeks from 40 to 52).

CDC flu view. cdc.gov/flu/weekly/ind…

Five-year average: 8.49% positive
This year: 0.18% Image
Influenza-Like Illness (ILI) continues to track well lower than the very mild 2015-16 season. Image
Read 6 tweets
4 Jan
DC reports 3 deaths with COVID. Now 9 total in January.

Positives / Tests %
1-Day: 140 / 3,119 4.49%
7-Day: 1562 / 35,244 4.43%
14-Day: 3164 / 86,981 3.64%
28-Day: 6585 / 182,035 3.62%
Positives and tests by week.

Note the dropout in negative tests was a holiday phenomenon observed nationally.
Total COVID-19 Patients in DC Hospitals: 251
Total COVID-19 Patients in ICU: 71
Total Patients in DC Hospitals (COVID and non-COVID): 1,921
Read 5 tweets
3 Jan
DC reports 2 deaths with COVID. Now 6 total in January.

Positives / Tests %
1-Day: 255 / 6,622 3.85%
7-Day: 1562 / 35,153 4.44%
14-Day: 3163 / 88,701 3.57%
28-Day: 6628 / 183,367 3.61%
Total COVID-19 Patients in DC Hospitals: 245
Total COVID-19 Patients in ICU: 69
Total Patients in DC Hospitals (COVID and non-COVID): 1,924
7-day Positives (raw and test-adjusted) and Deaths
Read 4 tweets
2 Jan
DC reports 4 deaths with COVID.

Positives / Tests %
1-Day: 257 / 7,076 3.63%
7-Day: 1553 / 37,751 4.11%
14-Day: 3167 / 90,379 3.50%
28-Day: 6637 / 183,991 3.61%
Total COVID-19 Patients in DC Hospitals: 237
Total COVID-19 Patients in ICU: 70
Total Patients in DC Hospitals (COVID and non-COVID): 1,929
7-day positives (raw and test-adjusted) and deaths
Read 4 tweets

Did Thread Reader help you today?

Support us! We are indie developers!


This site is made by just two indie developers on a laptop doing marketing, support and development! Read more about the story.

Become a Premium Member ($3/month or $30/year) and get exclusive features!

Become Premium

Too expensive? Make a small donation by buying us coffee ($5) or help with server cost ($10)

Donate via Paypal Become our Patreon

Thank you for your support!

Follow Us on Twitter!