A Thread 🧡

βœ… What is Cup and Handle pattern and how to use in trading ??

βœ… Bullish and Bearish C&H pattern.

A detailed Thread on C&H pattern with graphical + Practical examples.

Retweet and Like to help Beginners and Others !! πŸ™
Cup & Handle pattern

β€’ A cup and handle is a technical chart pattern that resembles a cup and handle where the cup is in the shape of a "u" and the handle has a slight downward drift.

β€’ It is a trend continuation pattern

β€’ Occurs after a decent uptrend or downtrend.
β€’ Easy to identify as it looks like a cup with a handle.

β€’ C&H pattern made popular by William O’Neil in β€œHow to Make Money in Stocks.”

βœ… Types of C&H pattern

1- Bullish C&H pattern
2- Bearish C&H pattern

Graphical Examples πŸ‘‡
1- Bullish C&H pattern

β€’ It’s continuation pattern indicating bullish sentiment

β€’ It occurs after an uptrend

β€’ A bullish pattern suited for breakout traders

β€’ The cup should resemble a bowl or rounding bottom.
1- Bearish C&H pattern

β€’ It’s continuation pattern indicating bearish sentiment

β€’ It occurs after an downtrend

β€’ A bearish pattern suited for breakout traders

β€’ A bearish pattern can be a technical indicator for traders of a potential upcoming breakout.
It was developed by William O'Neil and introduced in his 1988 book, How to Make Money in Stocks.

Happy Reading !!

If you find is useful than spread the word πŸ™

@caniravkaria @rohanshah619
@PatilBankNifty @PAlearner
@Puretechnicals9 @PAVLeader

β€’ β€’ β€’

Missing some Tweet in this thread? You can try to force a refresh
γ€€

Keep Current with Chartmojo

Chartmojo Profile picture

Stay in touch and get notified when new unrolls are available from this author!

Read all threads

This Thread may be Removed Anytime!

PDF

Twitter may remove this content at anytime! Save it as PDF for later use!

Try unrolling a thread yourself!

how to unroll video
  1. Follow @ThreadReaderApp to mention us!

  2. From a Twitter thread mention us with a keyword "unroll"
@threadreaderapp unroll

Practice here first or read more on our help page!

More from @chartmojo

20 Jan
An Insightful Thread 🧡 πŸ‘‡

What are Tweezer Top & Bottom candlesticks ??

How to use Tweezers in Trading??

I’ve written a detailed thread on tweezers with practical example. πŸ‘‡

Retweet & Like to help Beginners and Others !!
Tweezer top & bottom can also be known as tweezers and these are reversal patterns that signal a potential change in the price direction of the trend.

tweezers are very popular with traders as they are searching for the clues for when the market will change its direction.
Tweezer Bottom

β€’ Its a 2 candlestick reversal pattern.

β€’ Tweezer Bottoms are bullish reversal patterns which appears at the bottom of downtrend.

β€’ The low of candle suggest strong support and shows the reversal is on the card.
Read 7 tweets
14 Jan
A thread 🧡 πŸ‘‡

What is golden Crossover ?

A detailed thread on golden crossover with practical example!

Retweet & Like to help beginners and others !
Golden Crossover

β€’ A technical chart pattern indicating potential for a majorly rally

β€’ It occurs when short term moving average crosses above long term moving average

β€’ It is a bullish breakout pattern which suggests an optimism.

Here is the graphical example! πŸ‘‡ Image
β€’ Once the breakout is done, moving averages acts as support

β€’ We commonly use 50 DMA & 200 DMA for Golden Crossover trading strategy

β€’ It works best with larger time frame/High accuracy in higher time frame
( 1D, 1W, 1M )

Here is the practical example! πŸ‘‡ Image
Read 4 tweets
5 Jan
A Thread 🧡

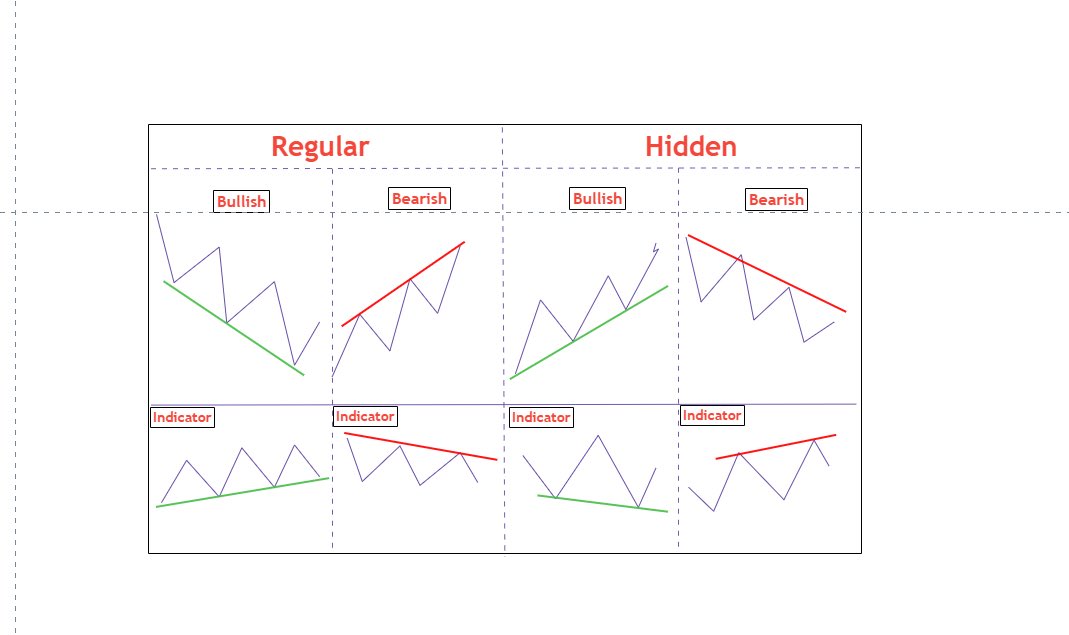
Detailed study on What is divergence and it’s types.

βœ… Regular Bullish & Bearish Divergence
βœ… Hidden Bullish & Bearish Divergence

Retweet and Like to help Beginners and Others !
1- What is Divergence ?

A scenario where price is moving opposite to technical indicator like RSI, MACD.

Divergence tells us whether the trend is weakening or not.

It is the hidden hand of weakness and strength and signal whether to hold a trade or book profits.
2- Types of Divergence

β€’ Regular Divergence
β€’ Hidden Divergence
Read 6 tweets
29 Dec 20
An Important Thread 🧡

What is pullback and it’s types ?

βœ… Shallow Pullback
βœ… Sharp Pullback

A detailed thread the pullback theory.

Retweet and Like to help others and Beginners!
Pullbacks are short term price drops during an uptrend.

There is a small hiccup in the market and that don’t change the underlying trend.

Pullback have dry up volume which can be noticed on the security.

Usually β€œBuy Low” traders exit after breakout with small profit. Image
The image below shows a practical example of pullback after the breakout. Image
Read 6 tweets
19 Dec 20
IMPORTANT THREAD πŸ§΅πŸ‘‡

How to Learn Technical Analysis ? (Beginners)

In this thread I have mentioned the 6 step process through which a newbie or a layman can learn Technical Analysis from the scratch level.

Retweet to help others and if you have doubts than you can DM me..
(Part-1)

1- Start learning with Zerodha Varsity
2- Practice candlestick + chart patterns for 1 months with no indicators.
3- Watch F2F video of @vivbajaj sir on @elearnmarkets (start with @Rishikesh_ADX wherein he teaches Dow theory In a very simple way)....
(Part-2)

5- Read Candlestick trading bible book (google out the PDF)
6- Now blend Dow theory with candlestick + chart patterns and see how it works.

Keep practicing and continue to train your eyes to see pattern and charts.
Read 4 tweets

Did Thread Reader help you today?

Support us! We are indie developers!


This site is made by just two indie developers on a laptop doing marketing, support and development! Read more about the story.

Become a Premium Member ($3/month or $30/year) and get exclusive features!

Become Premium

Too expensive? Make a small donation by buying us coffee ($5) or help with server cost ($10)

Donate via Paypal Become our Patreon

Thank you for your support!

Follow Us on Twitter!