Our daily update is published. States reported 1.6M tests, 152k cases, 107,444 people currently hospitalized with COVID-19, and 4,077 deaths. 4 bar charts showing key COVID-19 metrics for the US over ti
The 7-day average for COVID-19 cases is the lowest since November 30 and has fallen by more than 30% from its peak on January 12. daily bar charts with 7-day average lines showing COVID-19 c
The number of people currently hospitalized with COVID-19 is decreasing in every major US region. 7-day average cases and currently hospitalized with COVID-19
COVID-19 deaths are rising by 10% or more in 21 states across the US. Deaths are rising fastest in the West and South. block map of the US showing change in 7-day average deaths f
Today, we are announcing a beta of Version 2 of our API. Details of the new features are available here: headwayapp.co/the-covid-trac…

• • •

Missing some Tweet in this thread? You can try to force a refresh
 

Keep Current with The COVID Tracking Project

The COVID Tracking Project Profile picture

Stay in touch and get notified when new unrolls are available from this author!

Read all threads

This Thread may be Removed Anytime!

PDF

Twitter may remove this content at anytime! Save it as PDF for later use!

Try unrolling a thread yourself!

how to unroll video
  1. Follow @ThreadReaderApp to mention us!

  2. From a Twitter thread mention us with a keyword "unroll"
@threadreaderapp unroll

Practice here first or read more on our help page!

More from @COVID19Tracking

27 Jan
Our daily update is published. States reported 1.7M tests, 144k cases, 108,957 people currently hospitalized with COVID-19, and 3,734 deaths. 4 bar charts showing key COVID-19 metrics for the US over ti
The U.S. hit 25 million confirmed cases in our data today. This is only a fraction of the real number of infections, which modeling experts estimate is at least several times higher. A bar chart of cumulative U.S. cases showing the date on whi
The number of hospitalized COVID-19 cases is falling nearly everywhere in the country. (Among the outliers: Hawaii and Vermont numbers are quite small, and Kansas's data regularly bounces around.)
Read 5 tweets
24 Jan
Our daily update is published. States reported 1.9M tests, 174K cases, and 3,577 deaths. 114k people are currently hospitalized with COVID-19 in the US. Only two weeks ago, that number was 131k. Four charts showing the nationwide COVID-19 daily tests, dai
The weekly view today shows cases down 21%, with more modest but very welcome drops in hospitalizations and deaths. The 7-day average for cases has returned to pre-Thanksgiving levels. Tests are slightly down, possibly because most of the backlogs have now been resolved. Four charts showing the weekly tests, cases, average hospita
The reporting backlogs from Nov and Dec holidays make the past six weeks of case numbers look jumpy, but the drop we’re seeing now is very encouraging—though we’re still seeing almost three times as many new cases each day as we did at the summer peak. Chart showing the daily COVID-19 cases reported nationwide,
Read 4 tweets
22 Jan
Our daily update is published. States reported 1.9M tests, 185k cases, 119,927 people currently hospitalized with COVID-19, and 3,889 deaths. Four charts showing the nationwide COVID-19 tests, cases, cu
Over 400k people in the US have died of COVID-19. A reminder that our dataset does not include probable deaths reported in NY which is why this grim milestone lagged by a few days from other datasets. More details here: covidtracking.com/analysis-updat… Hex map showing the number of deaths per million residents i
Despite the alarmingly high death numbers, there are encouraging trends in COVID-19 case and hospitalization data. Read more about our weekly analysis here: covidtracking.com/analysis-updat… Two charts, showing the weekly reported cases and average we
Read 5 tweets
21 Jan
Our weekly update is published. Weekly cases are down 20%, and after 16 weeks of increases, weekly hospitalizations are down 4%. Yesterday’s record deaths brought the weekly total to 21,301―the 2nd highest number of deaths since the start of the pandemic. covidtracking.com/analysis-updat… 4 bar charts showing COVID-19 metrics week by week in the US
For the 2nd week in a row, LTC facilities reported the highest weekly death toll—over 7,000. It’s likely that winter holiday backlogs and a change in Iowa’s death reporting have influenced this high number. 3 weekly bar charts showing COVID-19 metrics in long-term-ca
On a more hopeful note, hospitalizations declined in almost every state over the past week. Only New York saw an increase in hospitalized patients (4% higher), while MA was essentially flat. US cartogram showing the change in COVID-19 hospitalizations
Read 4 tweets
17 Jan
Our daily update is published. States reported 2M tests, 215k cases, 126,139 people currently hospitalized with COVID-19, and 3,695 deaths. The 7-day average for tests is at a record high. 4 bar charts showing key COVID-19 metrics for the US over ti
After a major dip around the holidays, the number of reported tests has come back to record levels. A bar chart showing tests and the 7-day average for tests ac
The case and hospitalization numbers are at very high absolute levels, but — at least for the past few days — both measures have leveled off in all regions.
Read 4 tweets
16 Jan
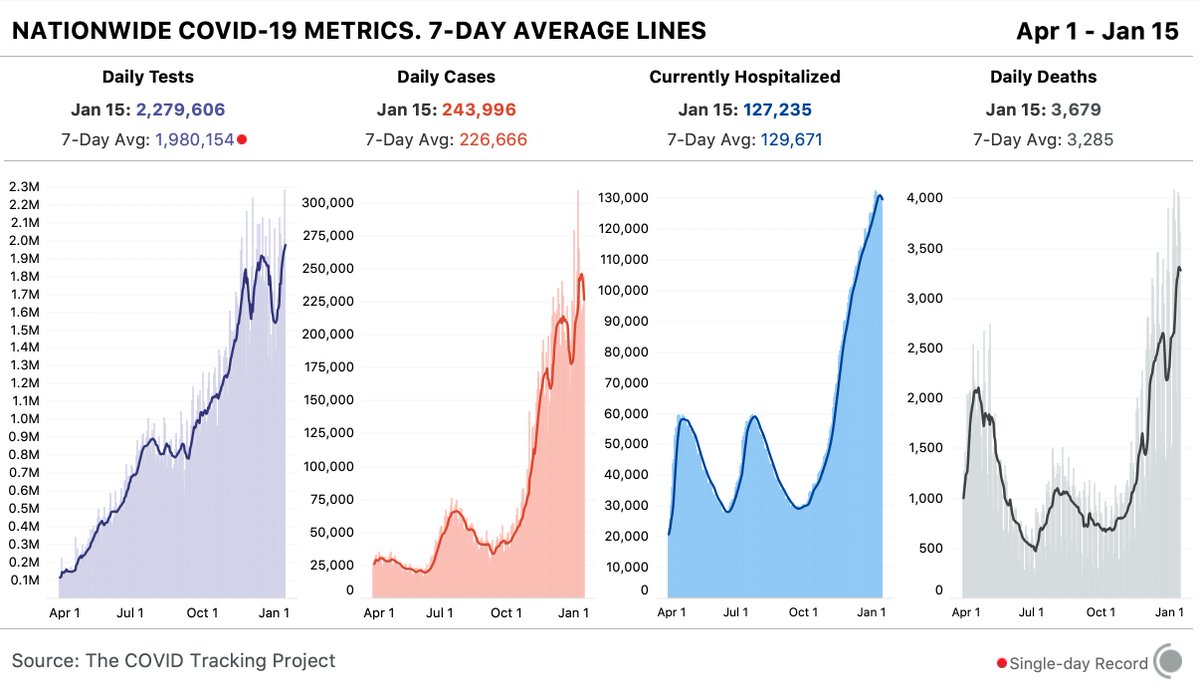
Our daily update is published. States reported 2.3M tests, 244k cases, 127,235 people currently hospitalized with COVID-19, and 3,679 deaths. The 7-day average for tests is at a record high. 4 bar charts showing key COVID-19 metrics and the 7-day aver
On a national level, it appears COVID-19 hospitalizations are on the decline. Note: there are still some jurisdictions experiencing an overwhelming amount of hospitalizations. a chart showing how many patients are hospitalized due to CO
Some encouraging news: the 7-day averages for cases are declining in all 4 regions. a line chart showing the 7-day average for regional cases pe
Read 8 tweets

Did Thread Reader help you today?

Support us! We are indie developers!


This site is made by just two indie developers on a laptop doing marketing, support and development! Read more about the story.

Become a Premium Member ($3/month or $30/year) and get exclusive features!

Become Premium

Too expensive? Make a small donation by buying us coffee ($5) or help with server cost ($10)

Donate via Paypal Become our Patreon

Thank you for your support!

Follow Us on Twitter!