Willy Woo Profile picture
30 Jan, 7 tweets, 2 min read
While we are in the first great consolidation of the 2021 bull market, here's a bunch of charts to get the feel of where we are in this bull cycle.

👇
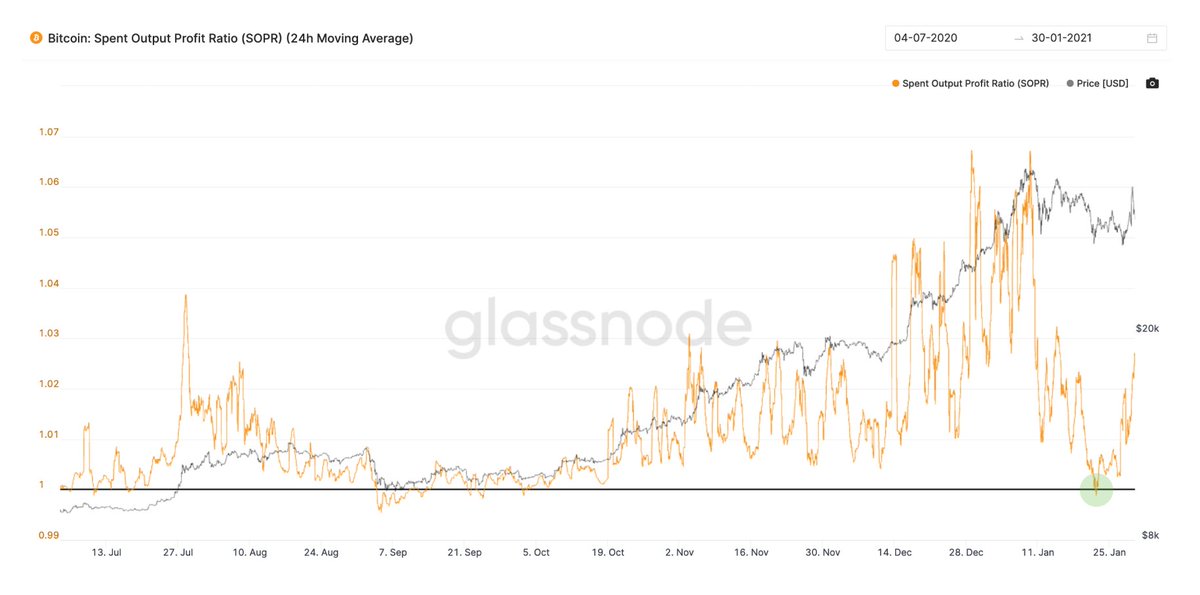
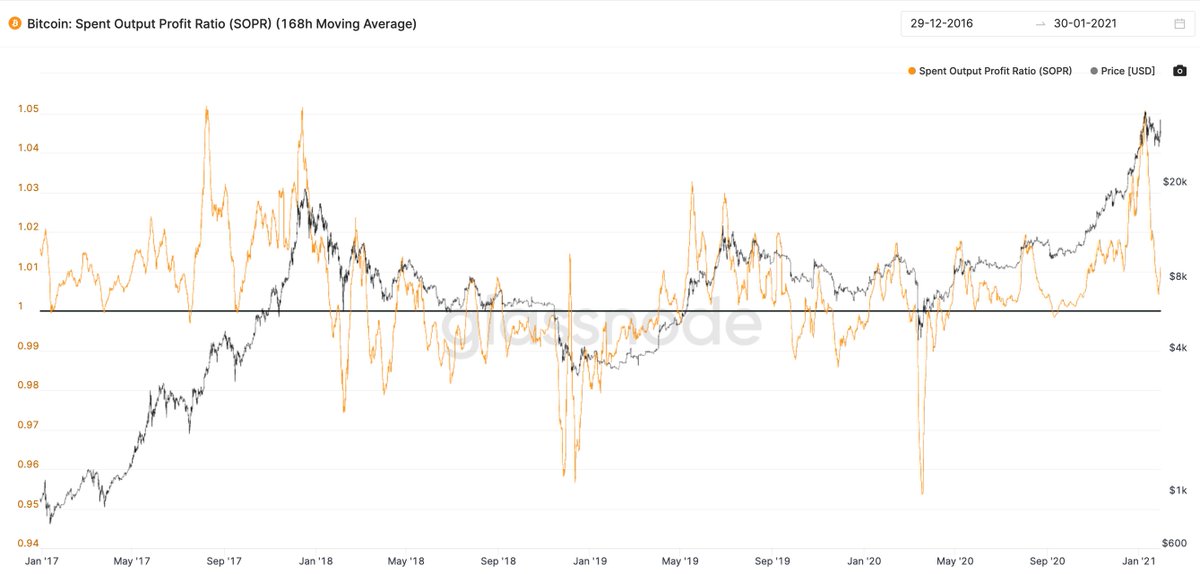
SOPR tracks profit-taken when coins being sold. It hit the 1.0 line which means we completely reset. To go lower we'd need to have investors sell at a loss. This would need a bear phase (that's is NOT on the cards with the current setup) Image
Here's how it looks in the longer time frame (1 week SOPR). Pretty close to a full reset, Elon kind of screwed with it, bounced us early. Image
On-chain RSI is in the lower band for this phase of the bull market. Pretty close to a full reset. The price is no longer overheated. Image
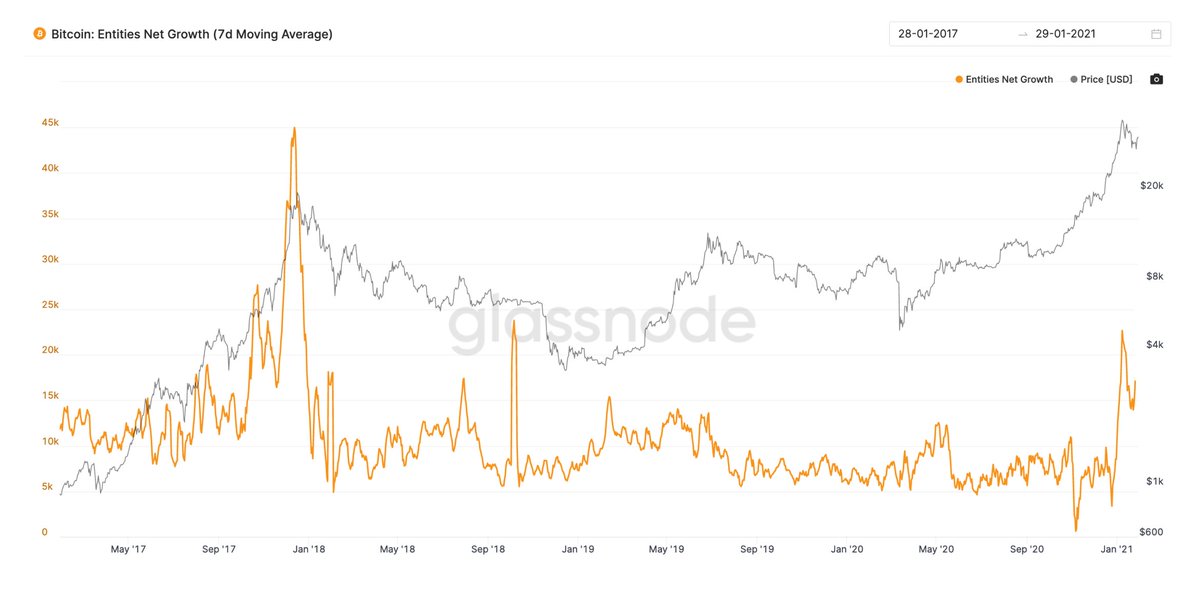
An indication of the sheer numbers of new Bitcoin users arriving here. Even during this consolidation, new users arriving per day is higher than any other time in this bull market. Image
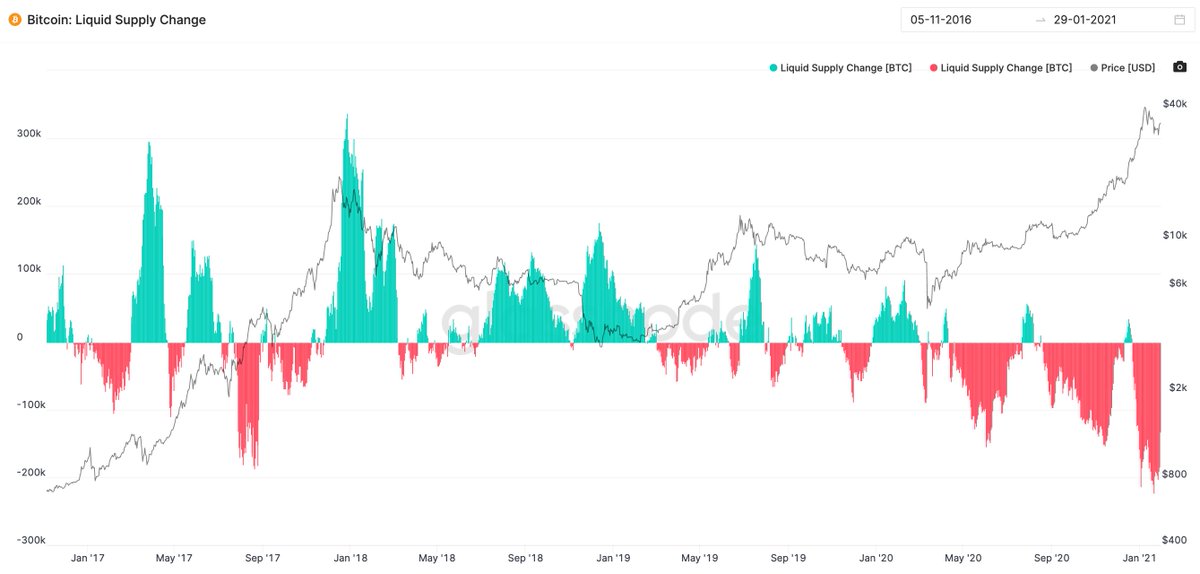
Coin buyers right now are extremely strong HOLDers. Coins moving to RED means HODLers who seldom sell. Image
With the current flows of capital coming in, the consolidation floor is expected to be $29k on daily closes (short of a black swan event), upper bound would be $56k (but rising quickly each day).

Charts via @glassnode

• • •

Missing some Tweet in this thread? You can try to force a refresh
 

Keep Current with Willy Woo

Willy Woo Profile picture

Stay in touch and get notified when new unrolls are available from this author!

Read all threads

This Thread may be Removed Anytime!

PDF

Twitter may remove this content at anytime! Save it as PDF for later use!

Try unrolling a thread yourself!

how to unroll video
  1. Follow @ThreadReaderApp to mention us!

  2. From a Twitter thread mention us with a keyword "unroll"
@threadreaderapp unroll

Practice here first or read more on our help page!

More from @woonomic

7 Nov 19
A thread on altcoins.

They are nuanced. We have:
-Protocol coins
-Utility tokens
-Security tokens
-Non-fungible tokens

But to an investor, there's only 2 types of altcoins. Oscillators and Degenerators. You can spot them on this chart of the entire market.

/1 Image
The vast majority of alt-coins are Degens. Their price chart has a measurable half-life, like radioactive decay. Plotted on a log chart, it's a straight line down. (This one is Namecoin, a promising coin of its era, there's over 2000 examples like this).

/2 Image
A handful are oscillators. Oscillators are proving SoV properties.

To qualify they need to keep up with BTCUSD gains. To find them, plot their BTC value. It must oscillate around a horizontal line, for at least one full bull-bear cycle (around 4yrs). More cycles are better.

/3 Image
Read 8 tweets

Did Thread Reader help you today?

Support us! We are indie developers!


This site is made by just two indie developers on a laptop doing marketing, support and development! Read more about the story.

Become a Premium Member ($3/month or $30/year) and get exclusive features!

Become Premium

Too expensive? Make a small donation by buying us coffee ($5) or help with server cost ($10)

Donate via Paypal Become our Patreon

Thank you for your support!

Follow Us on Twitter!