Some important news about CTP: After a year of collecting, analyzing, and interpreting COVID-19 data for the United States—and months of preparation for what we’re about to announce—we’re ending our data compilation work on March 7. covidtracking.com/analysis-updat…
We didn’t come to this decision easily, but we have believed from the very beginning of the project that the work of compiling, publishing, and analyzing COVID-19 data for the US properly belongs to federal public health agencies.
The CDC and HHS are now publishing data that is much more comparable to the figures we have been compiling from states since last spring. Gaps and inconsistencies remain, and we will continue to analyze federal data and document what we find through the end of May.
Between now and March 7, our data compilation will continue as before, as will our daily tweets, weekly updates, and ongoing research. We’ll also be posting guidance for our data users on switching over to federal or other alternate data sources.
We began this project to hold the federal government accountable for missing data. We ended up provisioning many kinds of COVID-19 data for the US for 11 months and counting. None of this would have been possible without the meticulous labor of hundreds of project contributors.
In the midst of a year of wrenching losses, the commitment of CTP volunteers to show up every day and do this painstaking work for the good of their neighbors has been sustaining for many of us. In human terms, it’s very hard to stop doing something like this once you’ve begun.
But after months of discussion with advisors and agencies, we believe this is the right thing to do for COVID-19 data in the US, and for our people as well. Please do take a moment to read the post if you have questions. covidtracking.com/analysis-updat…
We will be archiving everything we’ve published and publishing a lot more documentation and analysis in the coming weeks and months. We care about this data and about all the context around it, and we’re going through a very careful archive process.
One last thing—if you’ve used our data, we’d love to hear from you about how you used it, how it’s helped, or even what it’s meant to you. We’ll be back later today with the daily update. covidtracking.com/about/track-im…

• • •

Missing some Tweet in this thread? You can try to force a refresh
 

Keep Current with The COVID Tracking Project

The COVID Tracking Project Profile picture

Stay in touch and get notified when new unrolls are available from this author!

Read all threads

This Thread may be Removed Anytime!

PDF

Twitter may remove this content at anytime! Save it as PDF for later use!

Try unrolling a thread yourself!

how to unroll video
  1. Follow @ThreadReaderApp to mention us!

  2. From a Twitter thread mention us with a keyword "unroll"
@threadreaderapp unroll

Practice here first or read more on our help page!

More from @COVID19Tracking

2 Feb
Our daily update is published. States reported 1.4 million tests, 116k cases, 92,880 currently hospitalized, and 3,486 deaths. Alt-Text: 4 bar charts show...
2. For the first time since Nov 2, no state has more than 500 people per million hospitalized with COVID-19. alt-text: Hex map showing t...
States reported the fewest new cases on a Tuesday since Nov. 3 Alt-Text: bar chart showing...
Read 4 tweets
1 Feb
Our daily update is published. States reported 1.7M tests, 118k cases, 95,013 people currently hospitalized with COVID-19, and 2,055 deaths. Four bar charts showing key COVID-19 metrics for the US over
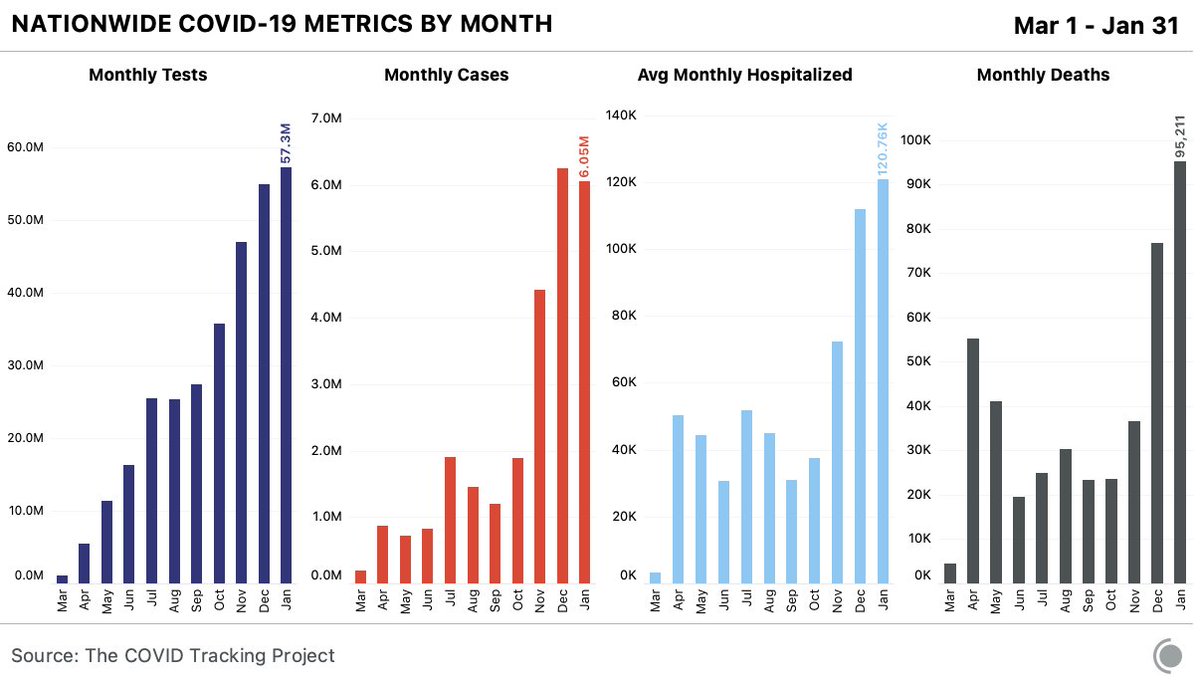
January saw the most deaths of any month so far at 95,211, nearly 20k more than in December. On average, more people were hospitalized than in any other month. Four bar charts showing key monthly COVID-19 metrics for the
At the same time, the 7-day average number of new cases is more than 40k fewer than at the beginning of the month and more than 100k fewer than at their peak on January 12. The number of people currently hospitalized is more than 37k fewer than at its mid-month peak. A line chart showing the nationwide 7-day average for both c
Read 4 tweets
31 Jan
Our daily update is published. States reported 2M tests, 147k cases, 97,561 people currently hospitalized with COVID-19, and 2,972 deaths. Alt-Text: 4 bar charts showing key COVID-19 metrics for the
Today’s update includes no data from CT, KS, LA, or RI, and no data except hospitalizations from AL. The MA update includes data from approximately 24,800 PCR tests not reported yesterday due to a technical problem.
In the weekly view, cases are down 14% and current hospitalizations are down 12%. Tests are down about 3%, and reported deaths rose about 2%. Alt-Text: 4 bar charts showing key weekly COVID-19 metrics f
Read 4 tweets
29 Jan
Our most recent look at the race and ethnicity data available from states has been published. The continued lack of consistent, comprehensive data makes it impossible to fully understand who is being infected with and dying of COVID-19.

covidtracking.com/analysis-updat…
More Black Americans have died of COVID-19 since the pandemic began than there are names on the Vietnam Memorial. More Black or Latinx people have died than the number of people commemorated on the AIDS Memorial Quilt. The loss to the country is on a catastrophic scale. Map showing the number of Black people who have died of COVI
The race and ethnicity data reported by states shows declining—but persistent—inequities. 1 in 6 Latinx people in Rhode Island and Utah has tested positive for COVID-19 since the pandemic began. Map showing the number of Latinx people who have or had COVI
Read 4 tweets
29 Jan
Our daily update is published. Our daily update is published. States reported 2.1M tests, 155k cases, 104,303 people currently hospitalized with COVID-19, and 4,011 deaths. 4 bar charts showing key COVID-19 metrics for the US over ti
Hospitalizations fell by over 3,000 today. There were big drops across all the major outbreak states. A bar chart showing the change in the number of currently ho
Hospitalizations are falling because cases are falling in every region. The West is back to pre-Thanksgiving levels. The Midwest is confirming fewer cases than at any time since mid-October. 4 bar charts showing a time series of cases in the four Amer
Read 4 tweets
28 Jan
Before the daily data, our weekly update is published.

COVID-19 cases fell in almost every state. Hospitalizations are down another 10% from last week, though still above levels seen in previous surges. Deaths, which lag, remain high and rose 7%.

covidtracking.com/analysis-updat… 4 bar charts showing COVID-19 metrics week by week in the US
In long-term-care facilities, cases and deaths both fell from a week ago—the first time these two metrics have fallen together so far in 2021. 3 bar charts showing weekly COVID-19 metrics in the US withi
On a more granular level, there were 515 counties on Dec 20 that were seeing 7-day average cases above 1 per 1,000 ppl. Now that figure is down to 287—a decline of over 44% in a month. 2 maps of the US showing counties experiencing over 1 case o
Read 5 tweets

Did Thread Reader help you today?

Support us! We are indie developers!


This site is made by just two indie developers on a laptop doing marketing, support and development! Read more about the story.

Become a Premium Member ($3/month or $30/year) and get exclusive features!

Become Premium

Too expensive? Make a small donation by buying us coffee ($5) or help with server cost ($10)

Donate via Paypal Become our Patreon

Thank you for your support!

Follow Us on Twitter!