1/n Long but an important educational thread. 🏆🏆🏆
Let's talk about a comprehensive way of finding huge runners using robust statistical techniques. I'll go over examples of $MARA $RIOT $SOLO $GME $MVIS $MKND. Let's stop YOLOing and start making educated decisoins.
Buckle up.
Let's talk about a comprehensive way of finding huge runners using robust statistical techniques. I'll go over examples of $MARA $RIOT $SOLO $GME $MVIS $MKND. Let's stop YOLOing and start making educated decisoins.
Buckle up.
2/n In any financial market, many instruments move together with each other. They can go up together or they can go down together. What quantifies this is called "Correlation".
For instance, $AAPL and $QQQ has a high correlation because they move together.
For instance, $AAPL and $QQQ has a high correlation because they move together.

3/n However, correlation does not help us "PREDICT" anything. It's just a tool that gives us insights into what moves together. Those insights are useful for a variety of purposes like finding sympathy plays, etc. But we don't want to talk about that today.
4/n What we want to talk about is called "Cointegration". Cointegration is a concept that quantifies whether two stocks remain at the same distance from each other. Why does it matter that we want to look at stocks that remain at the same distance from each other historically?
5/n It matters because when the same stocks deviate from each other, we can tell that it's an anomaly. They are supposed to stay at the same distance. Therefore, many times, if stocks go far out from each other in terms of distance, they'll converge back.
6/n This converging of stock prices to the mean distance between two stocks is called "Mean Reversion", a very famous concept in the quantitative finance world.
I still don't understand how to predict big winners with these. Let me explain with $GME and $MARA.
I still don't understand how to predict big winners with these. Let me explain with $GME and $MARA.
7/n $GME and $MARA has a very high mean reversion score. That means they tend to always revert back to their mean distance from each other.
What happened last week was a break of that statistical relation. $GME moved way too far.
What happened last week was a break of that statistical relation. $GME moved way too far.
8/n When $GME moved way too far and the distance became anomalous, statistics told us that GME was going to go down because of the mean reversion principle.
And since both $GME and $MARA were going to mean revert, $MARA would probably go up or atleast stay the same,
And since both $GME and $MARA were going to mean revert, $MARA would probably go up or atleast stay the same,
9/n Here's a Yinyang's alert for $GME and $MARA. Look at how the blue line went way apart from the normal range of 20 and -20. It was bound to back up.
What happened next? It went back up - see the white line. This is called a mean reversion play.
What happened next? It went back up - see the white line. This is called a mean reversion play.
10/n Here's the extension chart for $GME and $MARA.

11/n You might say "go away, that's just one example". Well, let's explore a few more.
Remember, stocks can break statistical relationships in the short term but most of the time, they don't break them in the long term.
Here's $MVIS and $BE next.
Remember, stocks can break statistical relationships in the short term but most of the time, they don't break them in the long term.
Here's $MVIS and $BE next.
12/n Since the alert two weeks ago, $MVIS is up 40% while $BE is only up 9%. They are starting to converge to their mean now which means $MVIS has to go up faster than $BE or $BE has to go down faster.
Whatever, we can go long $MVIS and short $BE to exploit this.
Whatever, we can go long $MVIS and short $BE to exploit this.


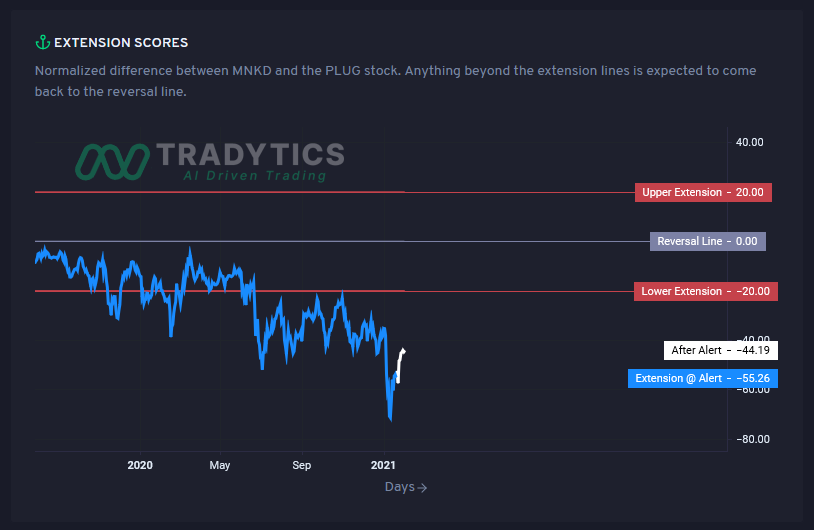
13/n Another example of $PLUG and $MKND. $PLUG was way too overextended in terms of its distance from $MKND. In the last 2 weeks, $MKND moved 34% to cover that distance and the call contract from $MKND moved 800 freaking percent.
See how the white line always starts to go back
See how the white line always starts to go back

14/n Does it fail? Obviously yes. If there was a silver bullet, I would be a billionaire. But there isn't one. Sometimes, the mean reversion relation gets broken because of both fundamental and technical reasons.
What to do then? That's where stop losses come into play.
What to do then? That's where stop losses come into play.
15/n Since many of these setups are going to work eventually, a great thing you can do is just set stoplosses for both bullish and bearish stock if the mean reversion relationship gets broken. That avoids any large losses.
16/n That was my rant about mean reversion. It works quite well in practice and I've run some backtests over 20 years to find out that it does outperform the market indexes. Add some human effort on top and you've got a killer formula.
17/n You can write your own software for this or you can just follow the weekly alerts we post in our Yinyang tool. We've added a few hacks on top to make the alerts a bit more robust.
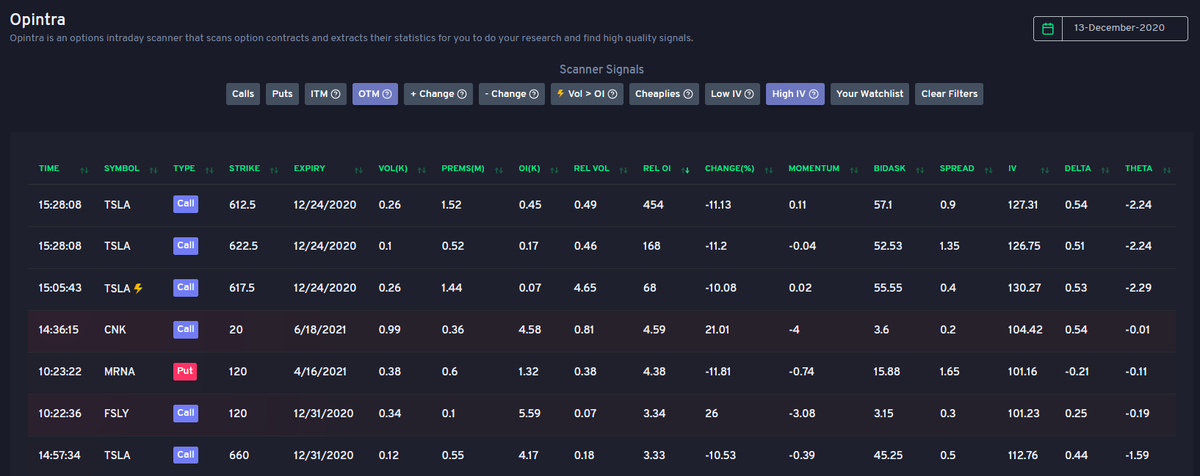
Finally, here are some alerts from this week. These are not daily alerts, so they can take weeks to pan out. But most of them do end up working very well.
I don't want to send you folks with nothing after reading this entire thread.
$BBBY $GME $APPN $PLUG $MARA
I don't want to send you folks with nothing after reading this entire thread.
$BBBY $GME $APPN $PLUG $MARA

Please note that there is no cherry picking here. I literally just took a screenshot of the first 10-15 alerts and shared them here.
And you can see how some of them have worked out like $GME $BBBY, $SOLO $MARA pair, etc.
And you can see how some of them have worked out like $GME $BBBY, $SOLO $MARA pair, etc.
• • •
Missing some Tweet in this thread? You can try to
force a refresh