💥🇸🇪The Sweden “Problem” SOLVED!🇸🇪💥
Or, how does a biased world rid itself of the best example of a non-lockdown control for its horrible lockdown experiment?
Simple! CHANGE THE DATA.
Or, how does a biased world rid itself of the best example of a non-lockdown control for its horrible lockdown experiment?
Simple! CHANGE THE DATA.

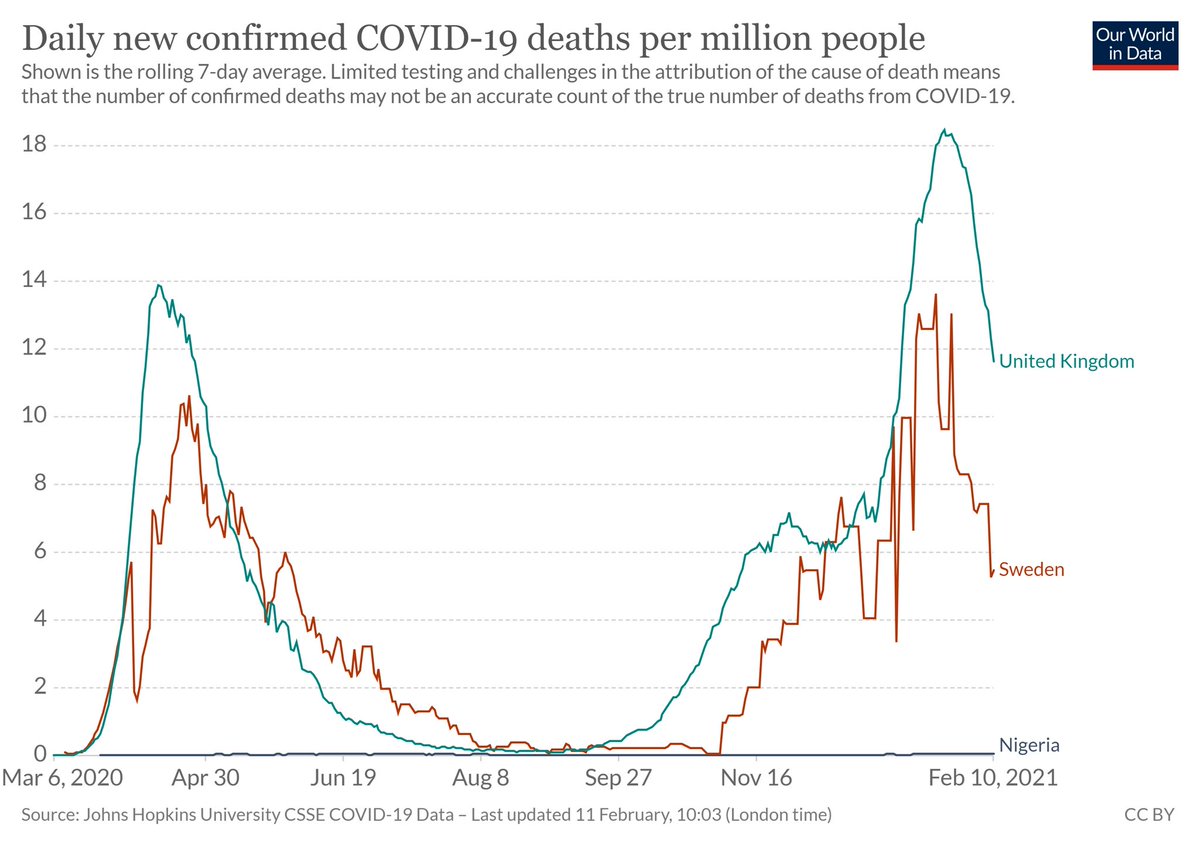
Of course we all know Sweden has been a battleground regarding its mild voluntary lockdown strategy versus the heavy lockdowns of most of the EU. Inconvenient graphs like this one are quite a thorn in Team Lockdown’s side. Sweden fewer deaths/M, much better quality of life. 
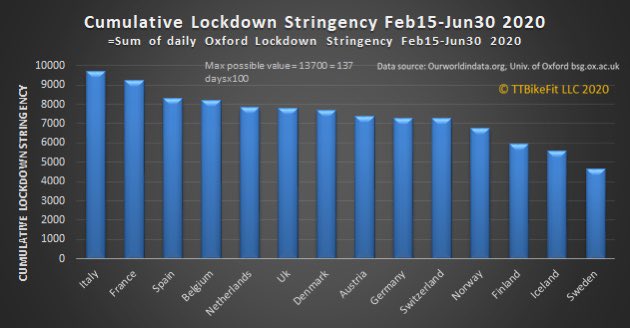
When I did some analysis in the Spring and Fall, I looked at Oxford’s stringency index as a proxy for lockdown severity. And sure enough Sweden was significantly lower stringency than all other EU countries. 
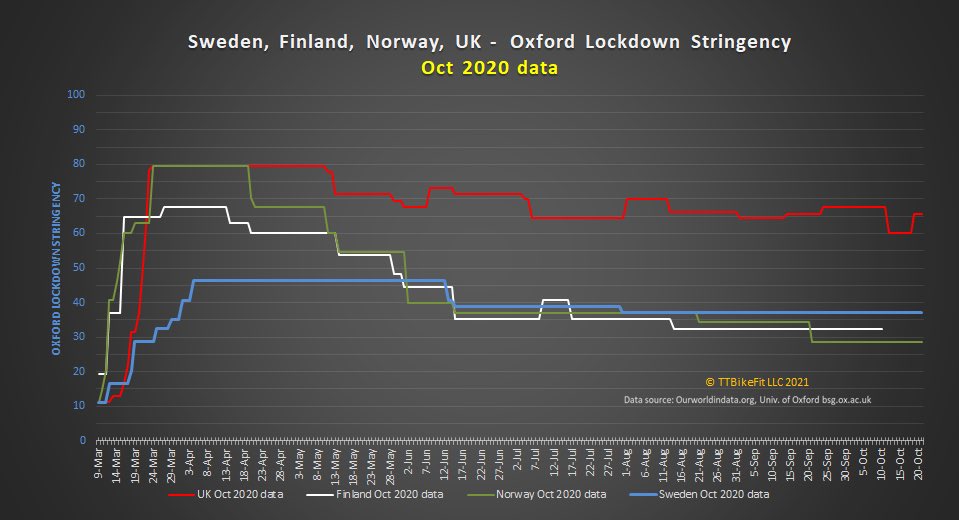
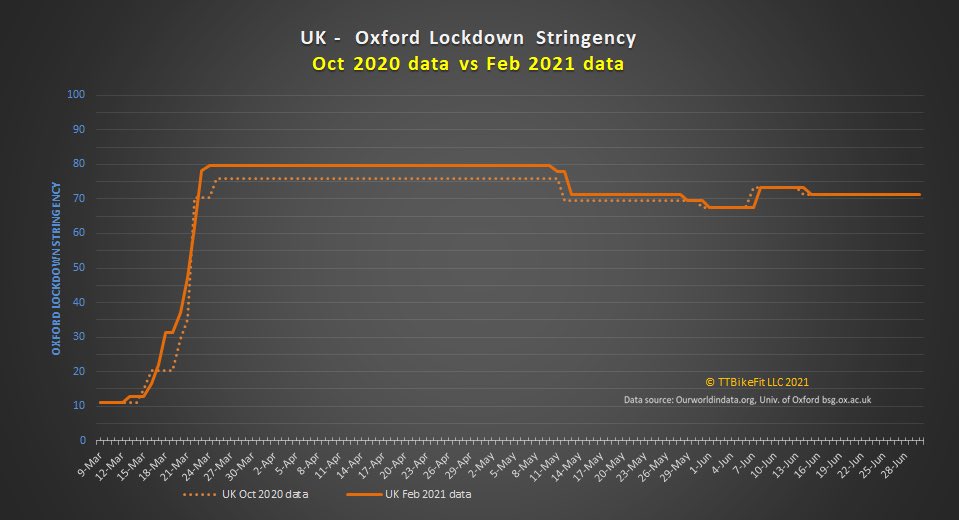
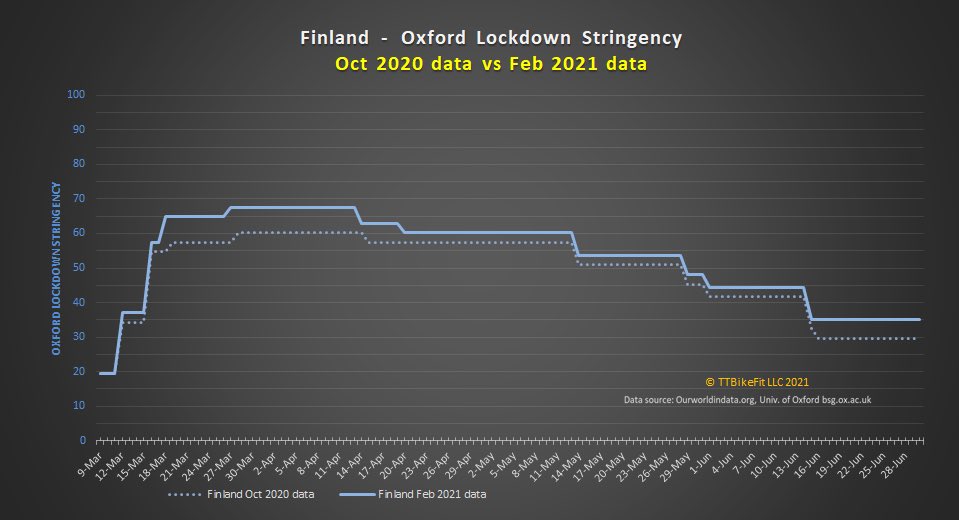
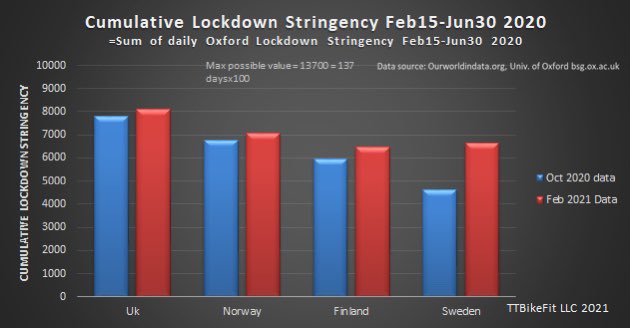
Here is a plot tracking stringency for the UK, Finland Norway and Sweden. I added Norway and Finland because Team Lockdown loves to reply to Sweden threads with “but Norway but Finland”! When I plotted this in October we see Sweden’s Spring stringency was comparatively low. 
But then I just happened to plot this again yesterday. What the heck? Sweden is no longer a mild-response country! It is only slightly less stringent than the UK! And the “but Norway Finland” argument is now moot! Look how much less stringent they’ve been! 
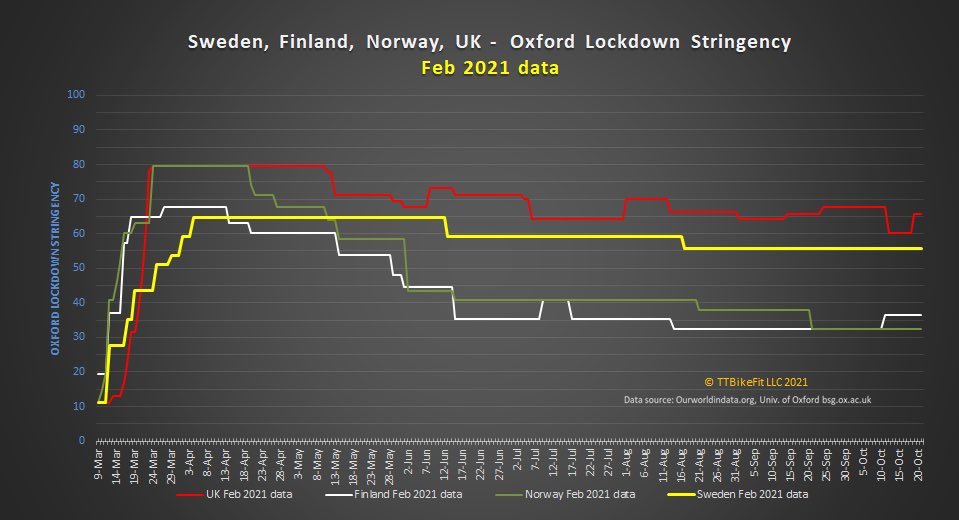
So apparently the whole “Sweden didn’t lockdown” thing is just a myth? Here is the comparison between Oxford’s assessment of Sweden’s lockdown in October vs Now. Almost a 50% increase in stringency?! I am certain Swedes would be baffled by this. 
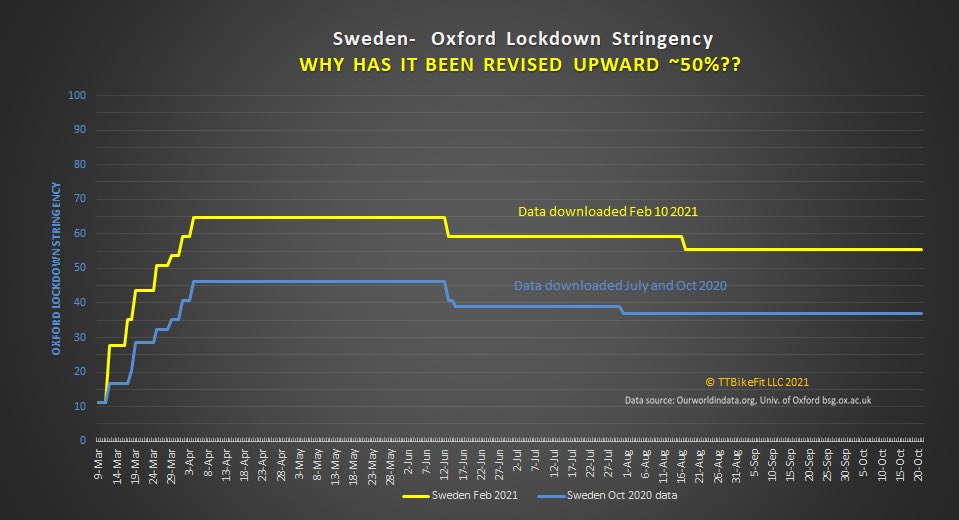
So then I thought I should look at other countries. Was their data revised significantly between Fall and Feb? Nope. Small revisions yes. Not huge revisions that change the entire thesis. 🤔 



What about the cumulative stringency compare- how does it change? Well now Sweden is above a few countries and on par with several more. 

So I of course had to contact Oxford OxCGRT Data Team and ask if this was all just a big mistake. Nope.
They had “several lengthy discussions” and decided to “update”the data. How do recent unenforceable decrees by the PM affect data from last Spring I replied?
They had “several lengthy discussions” and decided to “update”the data. How do recent unenforceable decrees by the PM affect data from last Spring I replied?
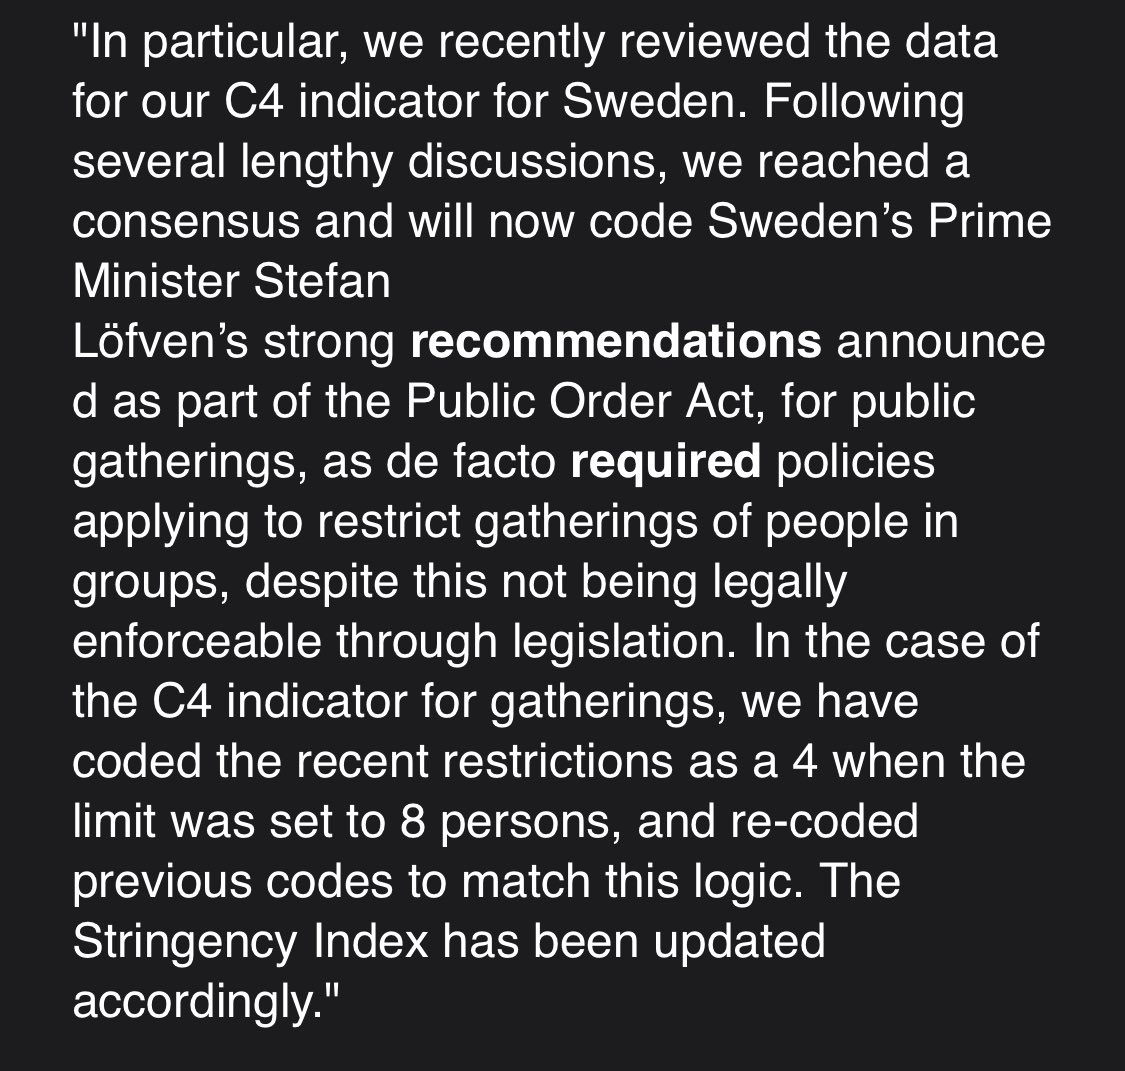
So there you have it. Down the memory hole goes Sweden’s non-lockdown control experiment. Now it was much like all other EU countries.
Makes their similar results much easier to explain for Team Lockdown! “See, Sweden really did lockdown! Oxford says so! Ignore the Swedes!”
Makes their similar results much easier to explain for Team Lockdown! “See, Sweden really did lockdown! Oxford says so! Ignore the Swedes!”
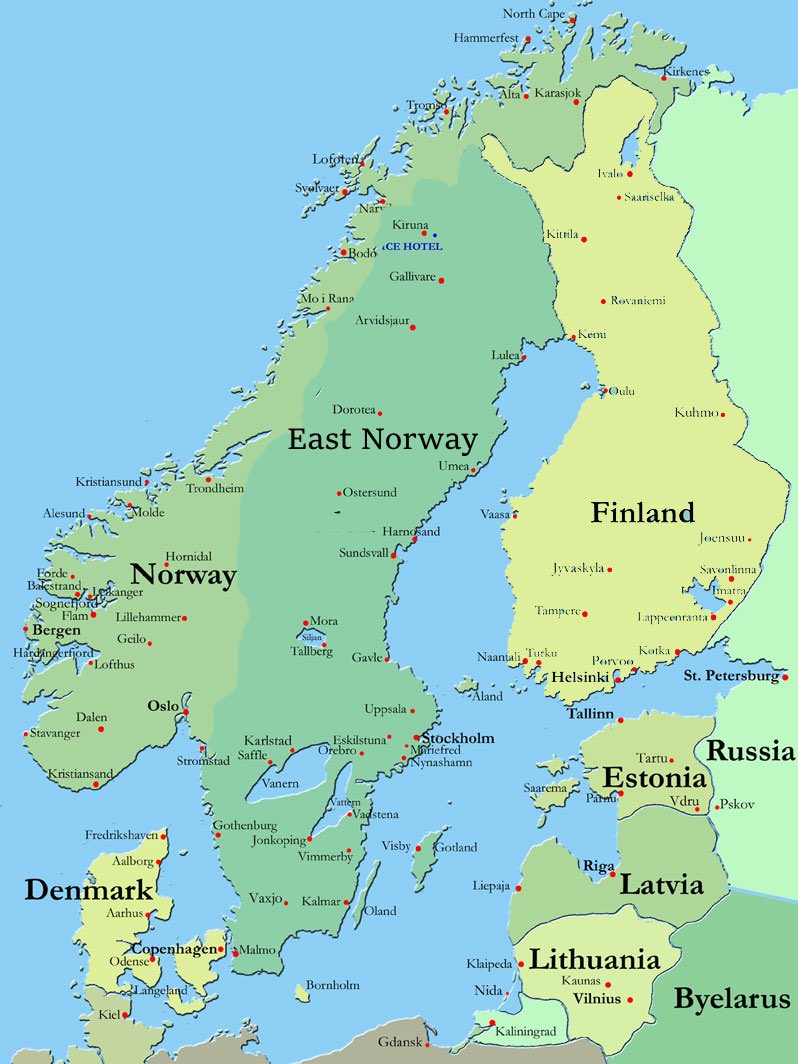
Inconveniently however, Team Lockdown’s favorite compares “but Norway and but Finland” now show similar/milder lockdowns than Sweden with far better results. Which would point out that lockdowns had little influence over deaths/M. Hence why lock down? 


So yes folks the fix is in. Don’t like what the control is telling you about your terrible experiment? Fudge the control data. If there is no control it’s much easier to make unverifiable assertions. This is all most convenient for the UK. Where is Oxford located again?
• • •
Missing some Tweet in this thread? You can try to
force a refresh


