Our daily update is published. States reported 1.1 million tests, 55k cases, 65,455 people currently hospitalized with COVID-19, and 1,078 deaths. 4 bar charts showing key COVID-19 metrics for the US over ti
Today's case count is the lowest since Oct 18 and today's death count is the lowest since Nov 30.
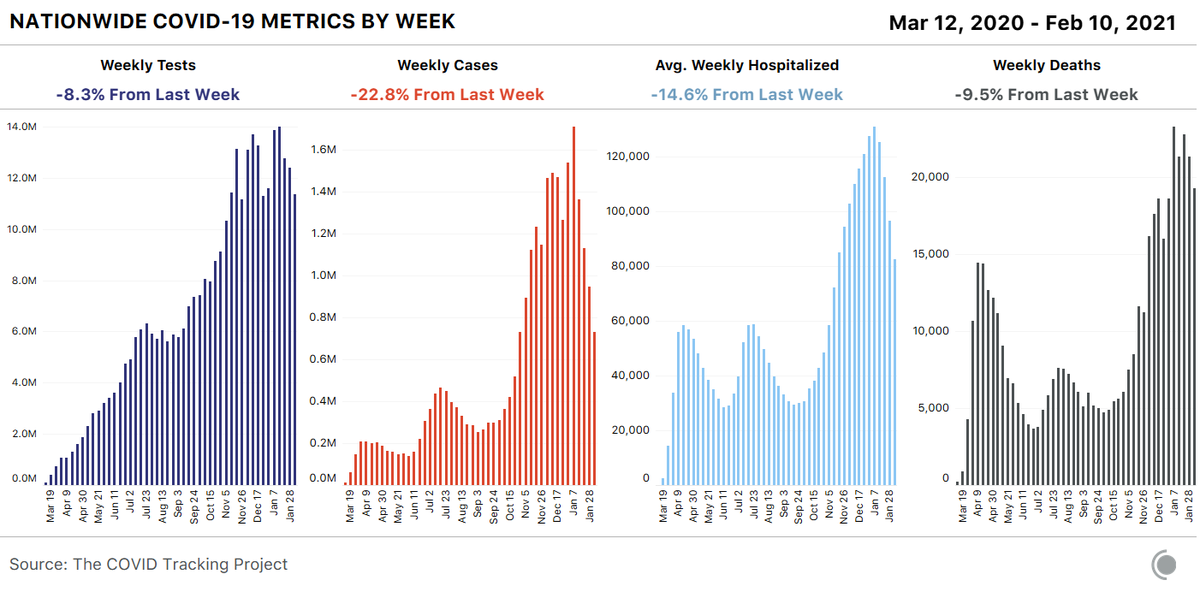
The number of people currently hospitalized with COVID-19 has dropped in half from the peak in January. A chart showing how many people are hospitalized with COVID-
An important caveat: Today's data is missing updates from AK, ID, MP, WA, and WY. Partial updates were provided from several other states. There may be a slight holiday effect reflected in data later this week.

• • •

Missing some Tweet in this thread? You can try to force a refresh
 

Keep Current with The COVID Tracking Project

The COVID Tracking Project Profile picture

Stay in touch and get notified when new unrolls are available from this author!

Read all threads

This Thread may be Removed Anytime!

PDF

Twitter may remove this content at anytime! Save it as PDF for later use!

Try unrolling a thread yourself!

how to unroll video
  1. Follow @ThreadReaderApp to mention us!

  2. From a Twitter thread mention us with a keyword "unroll"
@threadreaderapp unroll

Practice here first or read more on our help page!

More from @COVID19Tracking

15 Feb
States reported 1.4 million tests, 72k cases, 67k people hospitalized with COVID-19, and 1,363 deaths.4 bar charts showing key COVID-19 metrics for the US over time. 4 bar charts showing states reporting 1.4M tests, 72k cases,
The case declines that we've seen have been massive since mid January, falling far more than the number of tests reported. Chart showing 7-day average COVID-19 cases and tests per mil
Cases are falling everywhere, but not at the same speed. South Carolina, for example, has been declining more slowly than other states and now has the most cases per capita over the last week. Line chart showing new cases per million people by state. So
Read 5 tweets
14 Feb
Our daily update is published. States reported 1.7M tests, 90k cases, 69,283 people currently hospitalized with COVID-19, and 2,303 deaths. Four bar charts showing key COVID-19 metrics for the US sinc
The reported new cases, people hospitalized, and new deaths decreased again this week. This week had the fewest reported new cases since October, and the fewest COVID-19 deaths of any in 2021. Four charts showing the weekly tests, cases, average hospita
We are still well above the numbers reported during the spring and summer surges. More than 18M people have tested positive for COVID-19 since October. More than 137k people have died of COVID-19 in 2021.
Read 4 tweets
11 Feb
Our weekly update is published. COVID-19 cases are down 23% from the previous week. Since the national peaks in January, cases are down 57% and hospitalizations are down 42%. Deaths are down 10% since last week. covidtracking.com/analysis-updat… 4 bar charts showing weekly COVID-19 metrics - tests, cases,
While most COVID-19 metrics are on a downward trend including the number of people currently hospitalized, new hospital admissions in the Northeast are moving slightly upward, most notably in NY and CT after last week’s winter snow storm. 4 bar charts with 7-day average overlaid showing daily hospi
Cases and deaths reported in long-term-care facilities declined between Jan 28 and Feb 4 (excluding MO and NY, both of which recorded large backfills of LTC deaths). 3 bar charts showing key COVID-19 metrics in long-term-care
Read 6 tweets
10 Feb
Our daily update is published. States reported 1.6M tests, 93k cases, 79,179 people currently hospitalized with COVID-19, and 2,795 deaths. Four bar charts showing key COVID-19 metrics for the US over
The 7-day average for new deaths has decreased by more than 15% since mid-January. Chart showing the US daily deaths from COVID-19, as well as
The trend in reported COVID-19 deaths is improving in every major US region. Chart showing the daily reported COVID-19 deaths as well as
Read 4 tweets
9 Feb
Our daily update is published. States reported 1.4M tests, 78k cases, 80,055 people currently hospitalized with COVID-19, and 1,309 deaths. 4 bar charts showing key COVID-19 metrics for the US over ti
While the weekend effect is most often reflected in Monday data, today's number of COVID-19 cases is still the lowest since Oct 27. Chart showing 7-day average COVID-19 cases and tests per mil
The number of people currently hospitalized with COVID-19 has dropped by 21k in 10 days. In the last week, hospitalizations have decreased by 10% or more in 40 states. charts showing daily reported number of people hospitalized
Read 4 tweets
6 Feb
Our daily update is published. States reported 1.8M tests, 114k cases, 84,233 people currently hospitalized with COVID-19, and 2,983 deaths. 4 bar charts showing key COVID-19 metrics for the US over ti
The number of people currently hospitalized with COVID-19 has dropped for 25 consecutive days. a chart showing the daily change in currently hospitalized d
For the second week in a row, no states have reported a record number of weekly COVID-19 cases. a chart showing the week of the highest daily positive cases
Read 4 tweets

Did Thread Reader help you today?

Support us! We are indie developers!


This site is made by just two indie developers on a laptop doing marketing, support and development! Read more about the story.

Become a Premium Member ($3/month or $30/year) and get exclusive features!

Become Premium

Too expensive? Make a small donation by buying us coffee ($5) or help with server cost ($10)

Donate via Paypal Become our Patreon

Thank you for your support!

Follow Us on Twitter!