If one believes the official statistics (and the associated interpretation being made by politicians), there is currently dramatic evidence that vaccination is vastly reducing deaths in Scottish care homes.
Is this interpretation based on solid data?
bbc.co.uk/news/uk-scotla…
Is this interpretation based on solid data?
bbc.co.uk/news/uk-scotla…
In both my training as a scientist and during my professional career in IT, I looked at a LOT of data.
A key requirement in both of these fields is the need for "interesting" results, to be reproducible.
If results can't be reproduced, that suggests a systemic error.
A key requirement in both of these fields is the need for "interesting" results, to be reproducible.
If results can't be reproduced, that suggests a systemic error.
For example, if one was conducting clinical trials of a new vaccine across two countries, which had similar background infection rates, but the results showed:
Vaccine in Country A has 95% efficacy
Vaccine in Country B has 25% efficacy
One would need to ask serious questions.
Vaccine in Country A has 95% efficacy
Vaccine in Country B has 25% efficacy
One would need to ask serious questions.
Maybe there was a screw up in Country B and a large number who should have been given the new vaccine were given placebo instead?
Maybe the age profile of participants in the trials across both countries is VERY different?
e.g. Many far older people in the Country B trial?
Maybe the age profile of participants in the trials across both countries is VERY different?
e.g. Many far older people in the Country B trial?
Simply put, if you THINK you're doing the same thing each time, but seeing VERY different results, something is (very probably) off.
Recheck your assumptions, carefully.
Look for patterns.
Beware of confirmation bias.
See this thread, especially:
Recheck your assumptions, carefully.
Look for patterns.
Beware of confirmation bias.
See this thread, especially:
https://twitter.com/nataliexdean/status/1362100687300042754?s=20
So, I've looked at the official records across Scotland (NRS), England/Wales (ONS) and Northern Ireland (NISRA).
For each week (of 2021), I have calculated the percentage of Covid-19 related Care Home deaths as a proportion of ALL Covid-19 related deaths in that country/region.
For each week (of 2021), I have calculated the percentage of Covid-19 related Care Home deaths as a proportion of ALL Covid-19 related deaths in that country/region.
North East England
Week 1 (Jan 8th) - 31.44%
Week 2 (Jan 15th) - 32.33%
Week 3 (Jan 22nd) - 26.52%
Week 4 (Jan 29th) - 30.86%
Week 5 (Feb 5th) - 32.56%
Fluctuating with no clear trend.
Week 1 (Jan 8th) - 31.44%
Week 2 (Jan 15th) - 32.33%
Week 3 (Jan 22nd) - 26.52%
Week 4 (Jan 29th) - 30.86%
Week 5 (Feb 5th) - 32.56%
Fluctuating with no clear trend.
North West England
Week 1 (Jan 8th) - 17.43%
Week 2 (Jan 15th) - 20.66%
Week 3 (Jan 22nd) - 24.23%
Week 4 (Jan 29th) - 24.95%
Week 5 (Feb 5th) - 21.26%
Fluctuating with a slight upward trend.
Week 1 (Jan 8th) - 17.43%
Week 2 (Jan 15th) - 20.66%
Week 3 (Jan 22nd) - 24.23%
Week 4 (Jan 29th) - 24.95%
Week 5 (Feb 5th) - 21.26%
Fluctuating with a slight upward trend.
Yorkshire and The Humber
Week 1 (Jan 8th) - 24.24%
Week 2 (Jan 15th) - 27.41%
Week 3 (Jan 22nd) - 21.79%
Week 4 (Jan 29th) - 24.03%
Week 5 (Feb 5th) - 25.71%
Fluctuating with no clear trend.
Week 1 (Jan 8th) - 24.24%
Week 2 (Jan 15th) - 27.41%
Week 3 (Jan 22nd) - 21.79%
Week 4 (Jan 29th) - 24.03%
Week 5 (Feb 5th) - 25.71%
Fluctuating with no clear trend.
East Midlands
Week 1 (Jan 8th) - 26.59%
Week 2 (Jan 15th) - 24.40%
Week 3 (Jan 22nd) - 28.10%
Week 4 (Jan 29th) - 31.15%
Week 5 (Feb 5th) - 30.85%
Fluctuating with a slight upward trend.
Week 1 (Jan 8th) - 26.59%
Week 2 (Jan 15th) - 24.40%
Week 3 (Jan 22nd) - 28.10%
Week 4 (Jan 29th) - 31.15%
Week 5 (Feb 5th) - 30.85%
Fluctuating with a slight upward trend.
West Midlands
Week 1 (Jan 8th) - 24.91%
Week 2 (Jan 15th) - 22.77%
Week 3 (Jan 22nd) - 27.01%
Week 4 (Jan 29th) - 27.93%
Week 5 (Feb 5th) - 25.00%
Fluctuating with no clear trend.
Week 1 (Jan 8th) - 24.91%
Week 2 (Jan 15th) - 22.77%
Week 3 (Jan 22nd) - 27.01%
Week 4 (Jan 29th) - 27.93%
Week 5 (Feb 5th) - 25.00%
Fluctuating with no clear trend.
East England
Week 1 (Jan 8th) - 21.81%
Week 2 (Jan 15th) - 25.73%
Week 3 (Jan 22nd) - 31.66%
Week 4 (Jan 29th) - 31.77%
Week 5 (Feb 5th) - 37.80%
Very clear (and large) upward trend.
Week 1 (Jan 8th) - 21.81%
Week 2 (Jan 15th) - 25.73%
Week 3 (Jan 22nd) - 31.66%
Week 4 (Jan 29th) - 31.77%
Week 5 (Feb 5th) - 37.80%
Very clear (and large) upward trend.
London
Week 1 (Jan 8th) - 8.60%
Week 2 (Jan 15th) - 8.57%
Week 3 (Jan 22nd) - 9.50%
Week 4 (Jan 29th) - 9.25%
Week 5 (Feb 5th) - 12.12%
Trending upwards.
Week 1 (Jan 8th) - 8.60%
Week 2 (Jan 15th) - 8.57%
Week 3 (Jan 22nd) - 9.50%
Week 4 (Jan 29th) - 9.25%
Week 5 (Feb 5th) - 12.12%
Trending upwards.
South East England
Week 1 (Jan 8th) - 31.58%
Week 2 (Jan 15th) - 30.26%
Week 3 (Jan 22nd) - 39.27%
Week 4 (Jan 29th) - 40.18%
Week 5 (Feb 5th) - 35.05%
Significant upward trend.
Week 1 (Jan 8th) - 31.58%
Week 2 (Jan 15th) - 30.26%
Week 3 (Jan 22nd) - 39.27%
Week 4 (Jan 29th) - 40.18%
Week 5 (Feb 5th) - 35.05%
Significant upward trend.
South West England
Week 1 (Jan 8th) - 34.04%
Week 2 (Jan 15th) - 38.19%
Week 3 (Jan 22nd) - 42.41%
Week 4 (Jan 29th) - 48.06%
Week 5 (Feb 5th) - 51.85%
Dramatic (and very alarming) upward trend.
Week 1 (Jan 8th) - 34.04%
Week 2 (Jan 15th) - 38.19%
Week 3 (Jan 22nd) - 42.41%
Week 4 (Jan 29th) - 48.06%
Week 5 (Feb 5th) - 51.85%
Dramatic (and very alarming) upward trend.
Wales
Week 1 (Jan 8th) - 20.26%
Week 2 (Jan 15th) - 26.12%
Week 3 (Jan 22nd) - 33.78%
Week 4 (Jan 29th) - 31.30%
Week 5 (Feb 5th) - 28.03%
Definite upward trend.
Week 1 (Jan 8th) - 20.26%
Week 2 (Jan 15th) - 26.12%
Week 3 (Jan 22nd) - 33.78%
Week 4 (Jan 29th) - 31.30%
Week 5 (Feb 5th) - 28.03%
Definite upward trend.
Northern Ireland
Week 1 (Jan 8th) - 20.87%
Week 2 (Jan 15th) - 26.54%
Week 3 (Jan 22nd) - 24.56%
Week 4 (Jan 29th) - 26.67%
Week 5 (Feb 5th) - 23.30%
Fluctuating with no significant trend.
Week 1 (Jan 8th) - 20.87%
Week 2 (Jan 15th) - 26.54%
Week 3 (Jan 22nd) - 24.56%
Week 4 (Jan 29th) - 26.67%
Week 5 (Feb 5th) - 23.30%
Fluctuating with no significant trend.
Scotland
Week 1 (Jan 4th) - 29.59%
Week 2 (Jan 11th) - 26.54%
Week 3 (Jan 18th) - 24.56%
Week 4 (Jan 25th) - 22.07%
Week 5 (Feb 1st) - 18.18%
Week 6 (Feb 8th) - 13.00%
Spectacular and VERY clear downward trend.
Week 1 (Jan 4th) - 29.59%
Week 2 (Jan 11th) - 26.54%
Week 3 (Jan 18th) - 24.56%
Week 4 (Jan 25th) - 22.07%
Week 5 (Feb 1st) - 18.18%
Week 6 (Feb 8th) - 13.00%
Spectacular and VERY clear downward trend.
So, the Scottish results APPEAR to be an amazing success story, BUT they are very much at odds with the results for the rest of the UK.
They stand out dramatically.
What gives?
They stand out dramatically.
What gives?
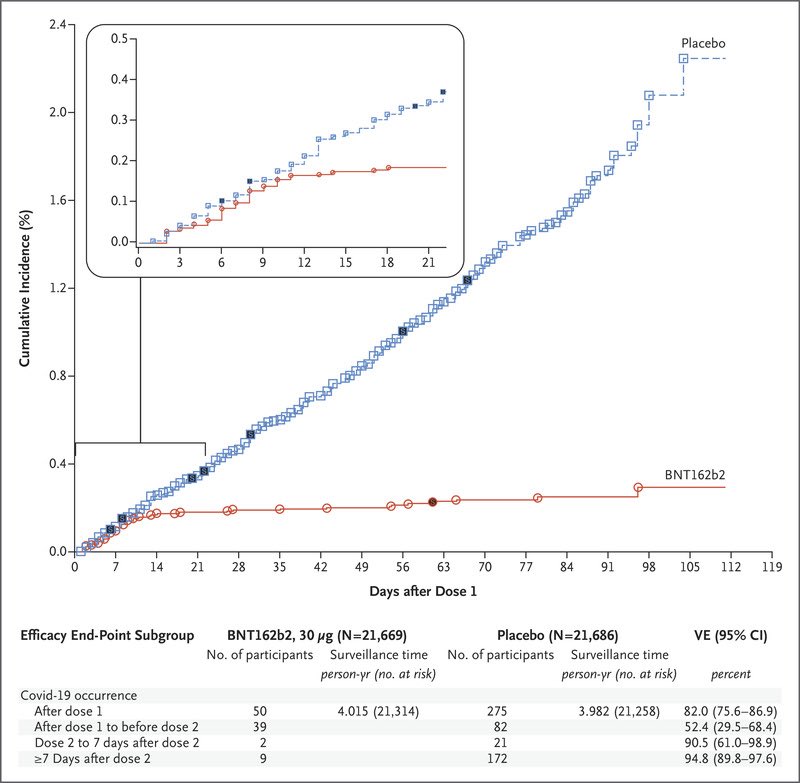
Bear in mind that similar Care Home vaccination strategies are being pursued across the UK, EXCEPT in Northern Ireland, where Care Home residents and staff have been given given 2 doses of Pfizer vaccine, 3 weeks apart, as per clinical trials.
One would expect a reduced immune response in the very elderly (normally) found in Care Homes. That was shown in the Pfizer study.
Yes, somehow, Scotland using a single dose is vastly outperforming Northern Ireland, where two doses have been given.
Is that credible? 🤔
Yes, somehow, Scotland using a single dose is vastly outperforming Northern Ireland, where two doses have been given.
Is that credible? 🤔
Recheck your assumptions, carefully.
Look for patterns.
Beware of confirmation bias.
Is there an alternative explanation?
I think there is.
Look for patterns.
Beware of confirmation bias.
Is there an alternative explanation?
I think there is.
In the ONS statistics, this definition is used:
The term "care home resident" used in this dataset refers to all deaths where either (a) the death occurred in a care home or (b) the death occurred elsewhere but the place of residence of the deceased was recorded as a care home.
The term "care home resident" used in this dataset refers to all deaths where either (a) the death occurred in a care home or (b) the death occurred elsewhere but the place of residence of the deceased was recorded as a care home.
In the NISRA data, it lists separately the deaths of Care Home residents who die in Care Homes and Care Home residents who have died in hospital.
I have combined both of these figures for the purposes of this analysis.
I have combined both of these figures for the purposes of this analysis.
My suspicion is that the Scottish data ONLY refers to Care Home residents who have actually died IN Care Homes.
The definition being used (related to this figure) is not clear in the NRS report.
The definition being used (related to this figure) is not clear in the NRS report.
This generic statement appears in the NRS report:
"The figures are produced using same definition as those published by the ONS (for England and Wales) and NISRA (for Northern Ireland), so are broadly comparable."
Broadly, is not neccessarily "entirely" comparable.
"The figures are produced using same definition as those published by the ONS (for England and Wales) and NISRA (for Northern Ireland), so are broadly comparable."
Broadly, is not neccessarily "entirely" comparable.
From the ONS and NISRA data, their respective definitions of Care Home deaths is very clear.
The NRS definition is somewhat opaque.
Which is more probable, truly miraculous results in Scotland relative to every other region in the UK, or not comparing like with like? 🤔
The NRS definition is somewhat opaque.
Which is more probable, truly miraculous results in Scotland relative to every other region in the UK, or not comparing like with like? 🤔
In the most recently published weekly NRS report, the Care Home deaths figure is 42.
One of my medical contacts told me that yesterday, in their hospital ward alone, there were 4 Care Home residents (with Covid-19) currently receiving end of life care.
One of my medical contacts told me that yesterday, in their hospital ward alone, there were 4 Care Home residents (with Covid-19) currently receiving end of life care.
It's clear that Covid-19 infections and deaths are falling generally.
It is also clear that Care Home residents have been highly vaccinated (with one Pfizer dose, apart from in Northern Ireland), relative to the general population.
Deaths are also typically a lagging indicator.
It is also clear that Care Home residents have been highly vaccinated (with one Pfizer dose, apart from in Northern Ireland), relative to the general population.
Deaths are also typically a lagging indicator.
However, one would reasonably expect a shorter "lag" with (typically) frail Care Home residents.
If the NRS definition is as I suspect it may be, that would potentially "square the circle" with the results of the rest of the UK.
If the NRS definition is as I suspect it may be, that would potentially "square the circle" with the results of the rest of the UK.
The NRS figures for last week list 42 Care Home Covid-19 related deaths out of 323 for Scotland, giving 13%.
If 25 Care Home residents died in hospital in the last 7 days, but don't appear in this Care Home Covid-19 deaths figure, this would have been 20.74%.
If 25 Care Home residents died in hospital in the last 7 days, but don't appear in this Care Home Covid-19 deaths figure, this would have been 20.74%.
Perhaps the NRS figures do use the same definition as the ONS figures?
Maybe a significantly higher proportion of Scottish Care Home residents have been vaccinated, relative to England and Wales?
However, one would expect to see similar (if diminished) trends in other regions?
Maybe a significantly higher proportion of Scottish Care Home residents have been vaccinated, relative to England and Wales?
However, one would expect to see similar (if diminished) trends in other regions?
Certainly, achieving vastly better results than Northern Ireland, where 2 doses have been given, seems REALLY odd. 🤔
Recheck your assumptions, carefully.
Look for patterns.
Beware of confirmation bias.
Ask questions.
Recheck your assumptions, carefully.
Look for patterns.
Beware of confirmation bias.
Ask questions.
P.S. The percentage of hospital-based Care Home residents who died with Covid-19 in Northern Ireland, was:
Week 1 (Jan 8th) - 37.5%
Week 2 (Jan 15th) - 37.0%
Week 3 (Jan 22nd) - 18.9%
Week 4 (Jan 29th) - 25.0%
Week 5 (Feb 5th) - 16.6%
Week 1 (Jan 8th) - 37.5%
Week 2 (Jan 15th) - 37.0%
Week 3 (Jan 22nd) - 18.9%
Week 4 (Jan 29th) - 25.0%
Week 5 (Feb 5th) - 16.6%
• • •
Missing some Tweet in this thread? You can try to
force a refresh