
10 charts that capture the state of Ethereum 👇
(1/10)
Number of addresses with more than 1 ETH in balance hit an ATH on December 12th - at 1.179 Million wallets
It is currently at 1.170 million. Slight sell-off with retail folks likely booking profits
Source : @glassnode
Number of addresses with more than 1 ETH in balance hit an ATH on December 12th - at 1.179 Million wallets
It is currently at 1.170 million. Slight sell-off with retail folks likely booking profits
Source : @glassnode

(2/10 )
Number of new addresses is trending towards the previous ATH.
Its previous ATH was at 348k in Jan 2018.
As of today it is at ~152k
(notice how it goes parabolic in the previous cycle)
Source : @glassnode
Number of new addresses is trending towards the previous ATH.
Its previous ATH was at 348k in Jan 2018.
As of today it is at ~152k
(notice how it goes parabolic in the previous cycle)
Source : @glassnode

(3/10)
The percentage in smart contracts is a good measure of how much of the network is "in use". Commonly this involves DeFi, ICOs etc.
This figure peaked in 2016 (i think with the DAO). During the ICO boom - i think ~4-6% of ETH was in smart contracts. it is at ~20%
The percentage in smart contracts is a good measure of how much of the network is "in use". Commonly this involves DeFi, ICOs etc.
This figure peaked in 2016 (i think with the DAO). During the ICO boom - i think ~4-6% of ETH was in smart contracts. it is at ~20%

(4/10)
The amount of ETH that is stagnant for 1-3 months has been on the rise. It is a good measure of how user behaviour on the network is changing. When we see upticks here, know that retail is going from speculating to holding
It is now at 17.3 million ETH
The amount of ETH that is stagnant for 1-3 months has been on the rise. It is a good measure of how user behaviour on the network is changing. When we see upticks here, know that retail is going from speculating to holding
It is now at 17.3 million ETH

(5/10) Part of what is likely contributing to that is rising fees. The average cost for an Ethereum transfer has risen from pennies to over $22
This hits close to home considering I was looking at Ethereum as a solution to bank the unbanked. L2's it is
Source : @santimentfeed
This hits close to home considering I was looking at Ethereum as a solution to bank the unbanked. L2's it is
Source : @santimentfeed

(6/10)
Hopefully that comes lower as Eth2.0 takes off.
Over 3 million Ethereum tokens have been locked up in the staking contract by ~5500+ addresses.
Source : @santimentfeed
Hopefully that comes lower as Eth2.0 takes off.
Over 3 million Ethereum tokens have been locked up in the staking contract by ~5500+ addresses.
Source : @santimentfeed

(7/10)
~27.5 million tokens are held between exchanges. Of which Coinbase has ~9million+ tokens.
Blockfi has ~200k tokens. An indication of the fact that lending desks are beginning to become large treasuries of their own
Source : @nansen_ai
~27.5 million tokens are held between exchanges. Of which Coinbase has ~9million+ tokens.
Blockfi has ~200k tokens. An indication of the fact that lending desks are beginning to become large treasuries of their own
Source : @nansen_ai

(8/10)
The past year has been incredible in terms of number of Bitcoin's that are in wrapped variations on Eth network.
The count has reduced due to dips in yield + btc price surging. There is about ~123k Bitcoin in wrapped forms on Ethereum.
Source : @nansen_ai
The past year has been incredible in terms of number of Bitcoin's that are in wrapped variations on Eth network.
The count has reduced due to dips in yield + btc price surging. There is about ~123k Bitcoin in wrapped forms on Ethereum.
Source : @nansen_ai

(9/10)
I wanted to go into NFT but that's for another time - last chart. This query from @DuneAnalytics showing the total number of DeFi users. This was at ~200k when I and @eliasimos were computing estimates for a report in ~Jan 2020.
Its still early days with ~1.5 mil users
I wanted to go into NFT but that's for another time - last chart. This query from @DuneAnalytics showing the total number of DeFi users. This was at ~200k when I and @eliasimos were computing estimates for a report in ~Jan 2020.
Its still early days with ~1.5 mil users

(10/10)
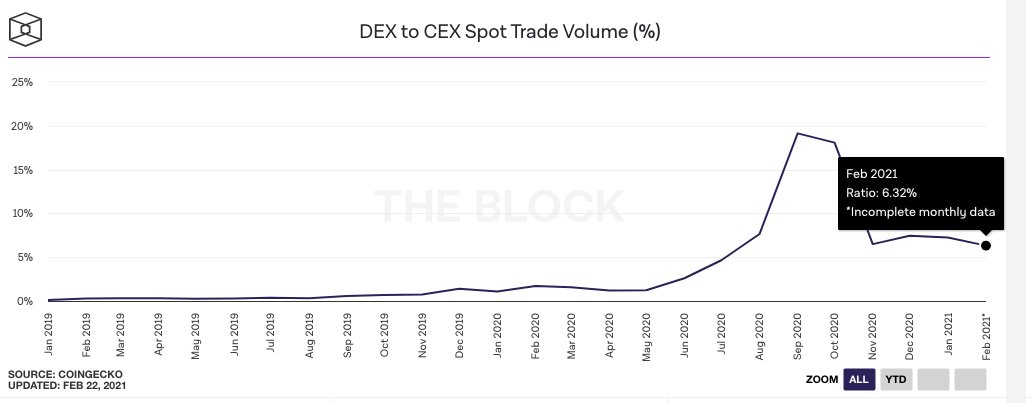
I promised ten charts so here's the last one from @TheBlock__'s data room- The Cex / dex volume %. As of today it is at 6%. Its peak was at ~20%. I assume a lot of that declining volume has to do with on-chain fees
I promised ten charts so here's the last one from @TheBlock__'s data room- The Cex / dex volume %. As of today it is at 6%. Its peak was at ~20%. I assume a lot of that declining volume has to do with on-chain fees
• • •
Missing some Tweet in this thread? You can try to
force a refresh


