🎉 Happy #RSTwittorial Thursday with @saksters 🥳
Analyzing Google Search Console Data with #Python 🐍🔥
Here’s the output 👇
Analyzing Google Search Console Data with #Python 🐍🔥
Here’s the output 👇
What you’ll learn:
🔎 How to clean and analyze GSC data, from creating basic pivot tables to graphing a CTR (Click-Through Rate) curve
🔎 How to clean and analyze GSC data, from creating basic pivot tables to graphing a CTR (Click-Through Rate) curve
How is this useful?
📌 This can be helpful in automating analyses designed to a specific client or domain that is being worked on
📌 This can be helpful in automating analyses designed to a specific client or domain that is being worked on
What you’ll need:
🧮 Numpy
📊 Matplotlib
📓 Colab or Jupyter Notebook with Pandas: github.com/ranksense/Twit…
🧮 Numpy
📊 Matplotlib
📓 Colab or Jupyter Notebook with Pandas: github.com/ranksense/Twit…
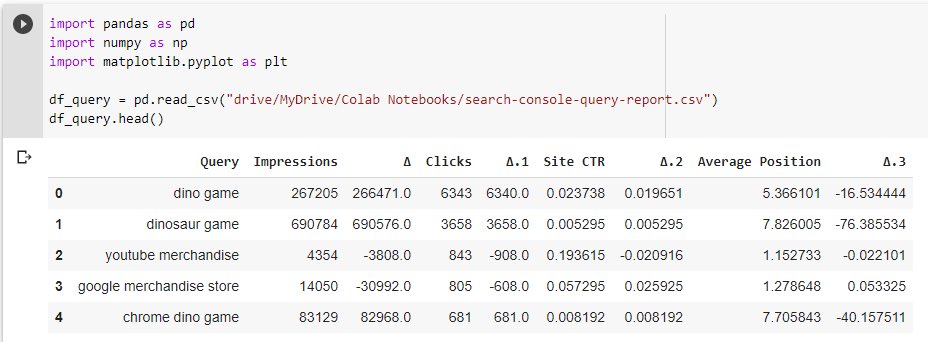
1️⃣ Import Libraries and Read in CSV
📌 Import the necessary libraries and read the CSV data that will be used for the analysis
📌 Import the necessary libraries and read the CSV data that will be used for the analysis

2️⃣ Clean the Data
📌 Clean the data up to make it easier for an analysis
📌 This includes removing null values, renaming columns, and having the right data types


📌 Clean the data up to make it easier for an analysis
📌 This includes removing null values, renaming columns, and having the right data types


3️⃣ Derive New Columns and Dataframes
📌 Segment or create values from the existing data to help with the analysis, such as a rounded position column or breaking down branded and non-branded dataframes

📌 Segment or create values from the existing data to help with the analysis, such as a rounded position column or breaking down branded and non-branded dataframes


4️⃣ Analysis & Ranking Distribution
📌 Aggregate the data into pivot tables to create a CTR curve
📌 We can gauge what positions have the highest CTR for each position in the SERP
📌 Displays the number of queries your site is ranking for each position

📌 Aggregate the data into pivot tables to create a CTR curve
📌 We can gauge what positions have the highest CTR for each position in the SERP
📌 Displays the number of queries your site is ranking for each position


Feel free to leave any questions below 👇 for @saksters and he will answer them during tomorrow’s webinar (⏰ 11:00 AM ET) where he will be doing a live walk-through of the script!
🤩 Register Here: us02web.zoom.us/webinar/regist…
🤩 Register Here: us02web.zoom.us/webinar/regist…

• • •
Missing some Tweet in this thread? You can try to
force a refresh


